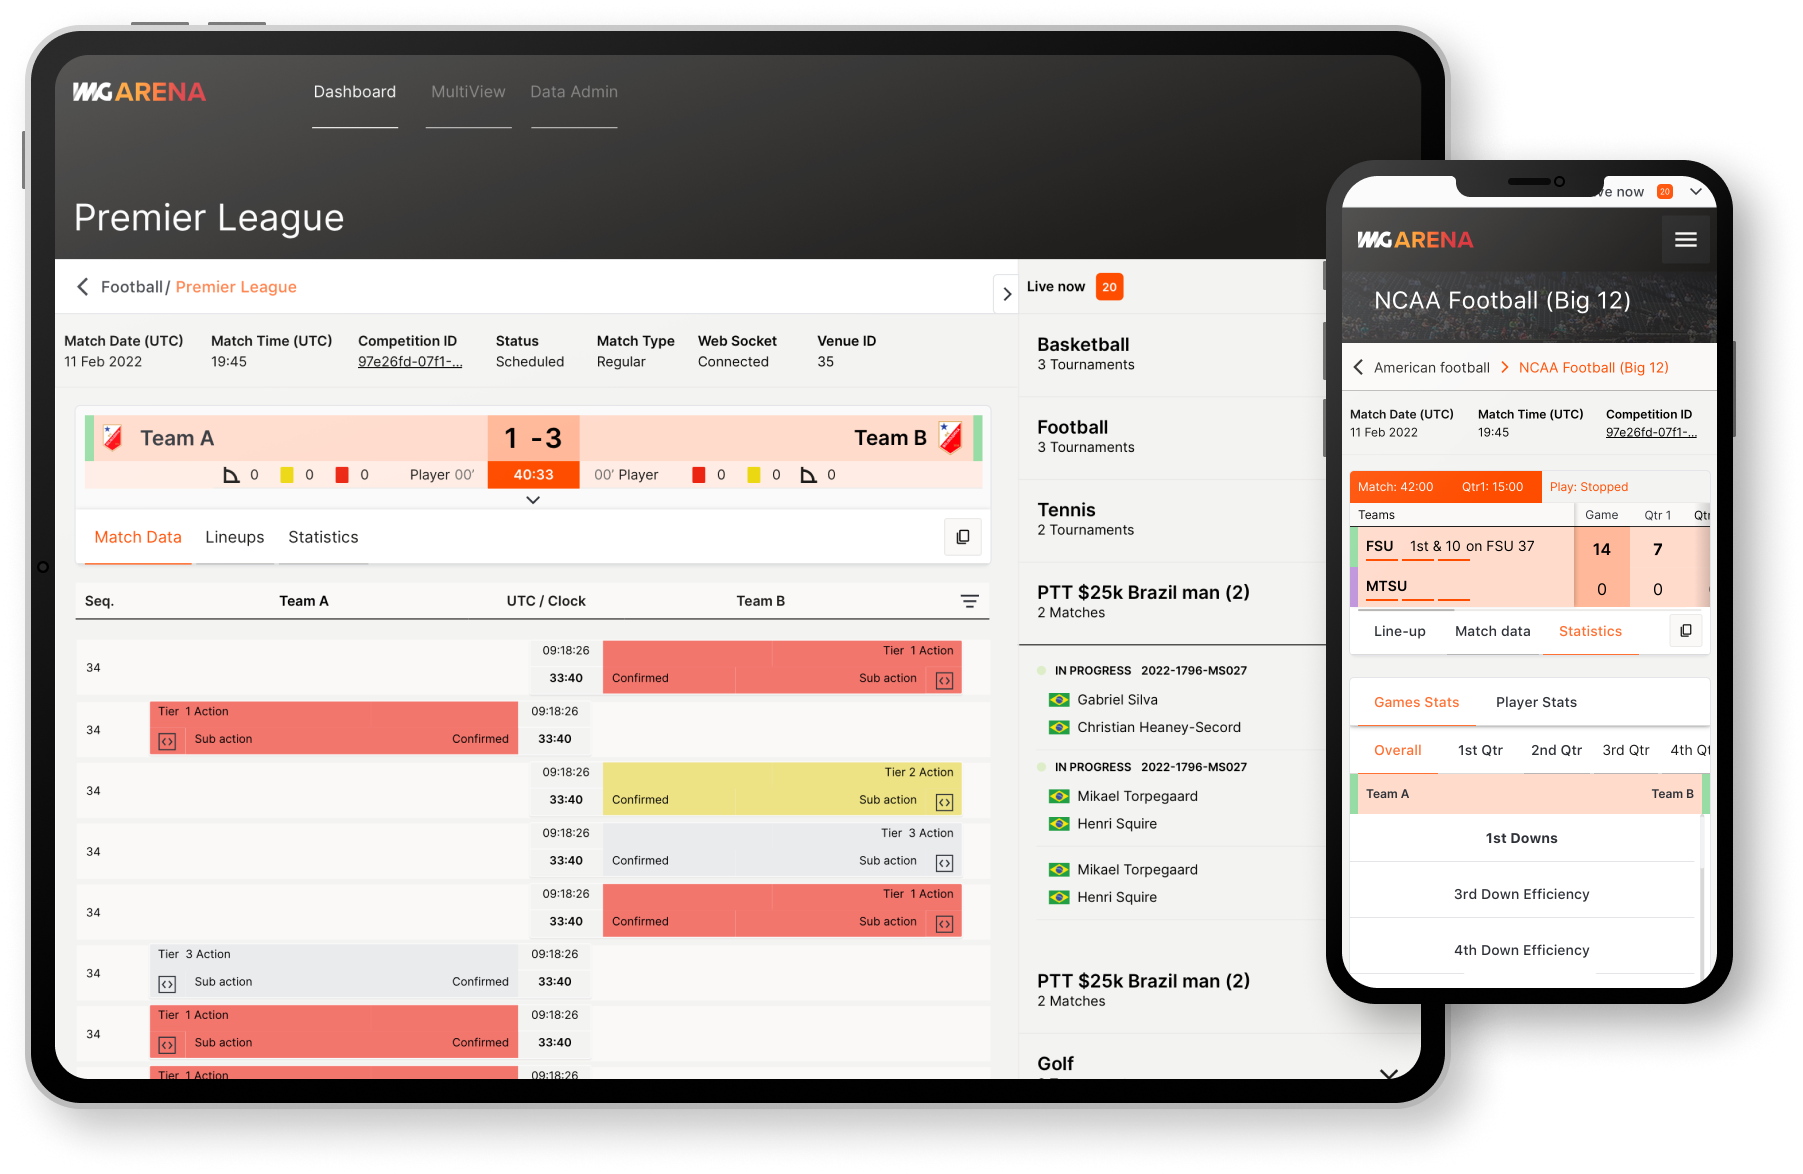
Sports Data Console
The data console is used by both internal teams and external clients to view the data collected for all sports an account has access to. Users view upcoming tournaments across multiple sports, which expand to show all fixtures and individual matches/ games. During the live status of any match/game - the real-time statistics and in-play actions are updated within the platform.
The task
This project required redesigning the existing platform whilst also being transitioned to a new technology stack. A review of user experience and features was addressed during the redesign in a fluid and agile manner.
Customer feedback and subject matter experts were interviewed to gather research, together with a review of data points that were prioritised for each sport. The review of data and feedback informed the team's decision-making and prioritisation of features and functions in both the UI design and code development.
New business initiatives and changes in negotiations added to challenges and the need to pivot priorities.
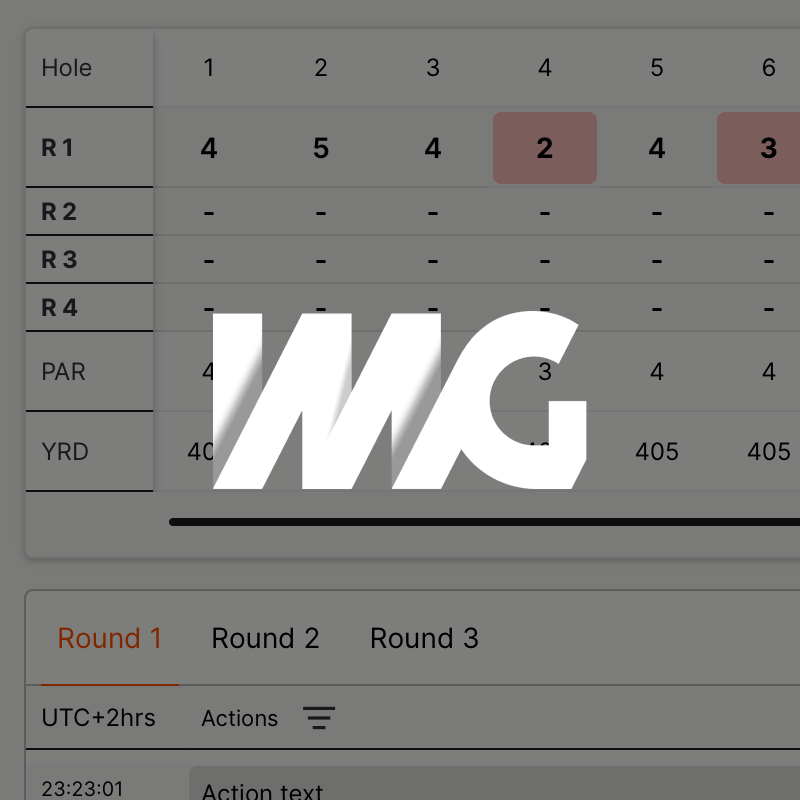
Scoreboard component
A key component of the redesign, the scoreboard needed to carry individual sports requirements based on data point priority. The team were also looking for a templated solution with generic foundations of the module that could be adapted.
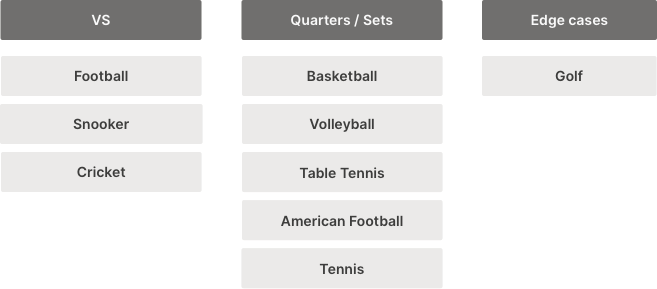
Sports were consolidated into a scoreboard type or determined as edge cases.
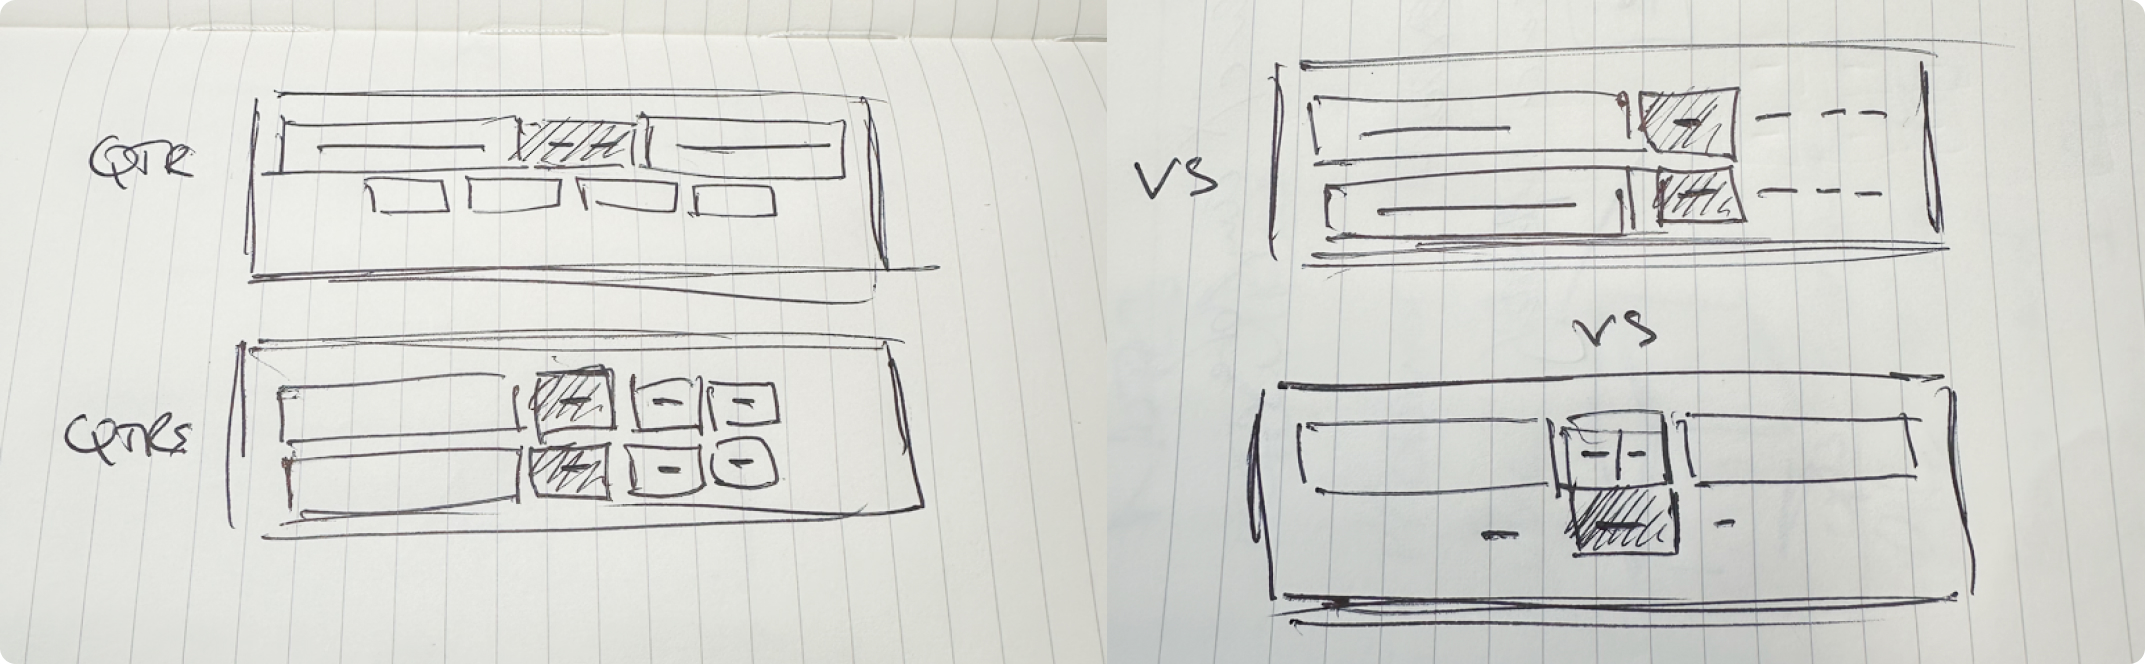
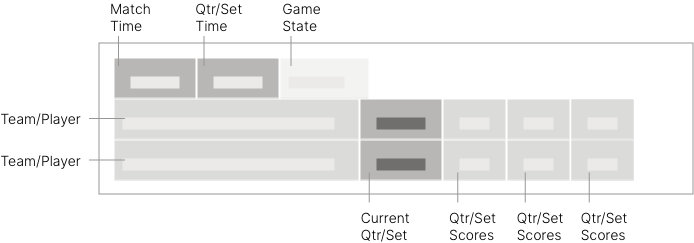
Sketching layouts to rapidly explore options and quickly uncover possible directions in flexibility for displaying scores, set scores and top-line game statistics or gameplay states.
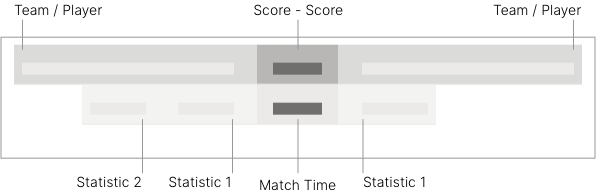
Wireframes of the sketched layouts were created to further test structures, variations and states of play through colour change.


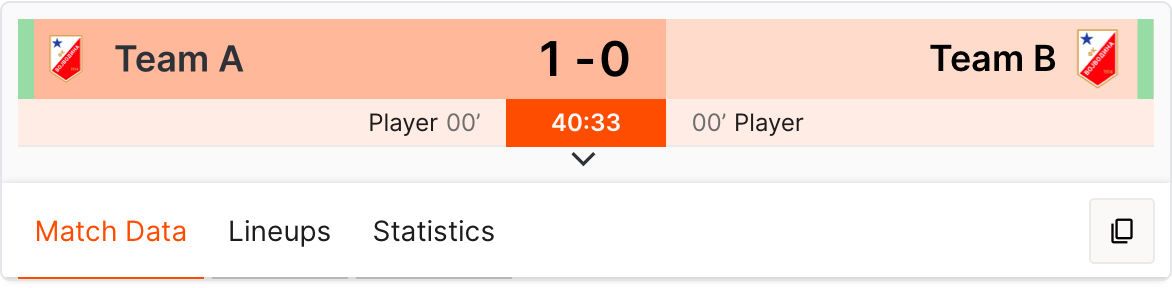
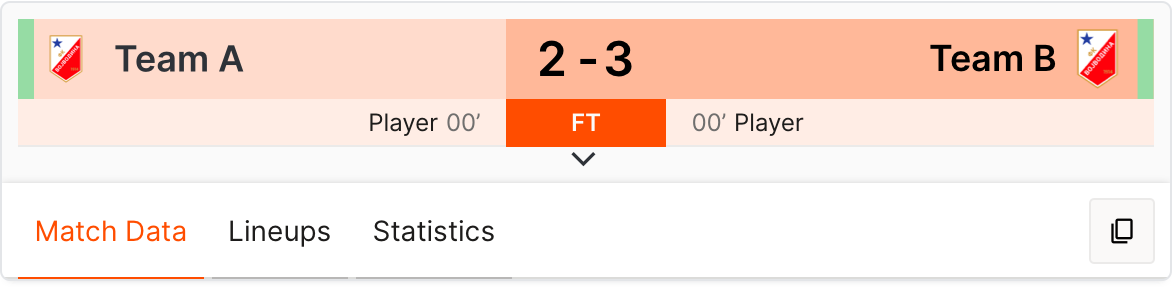
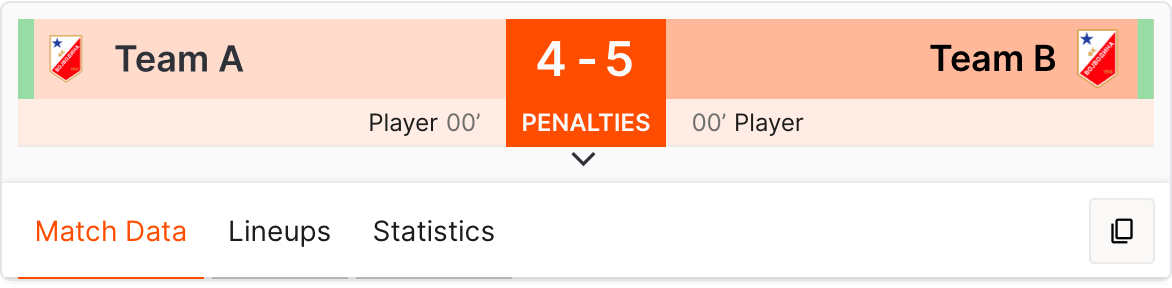
Scoreboard Final Designs
Additional game statistics or states were added such as; Timeout counters, 1st and Down states, Current break scores or batting and bowler player names.
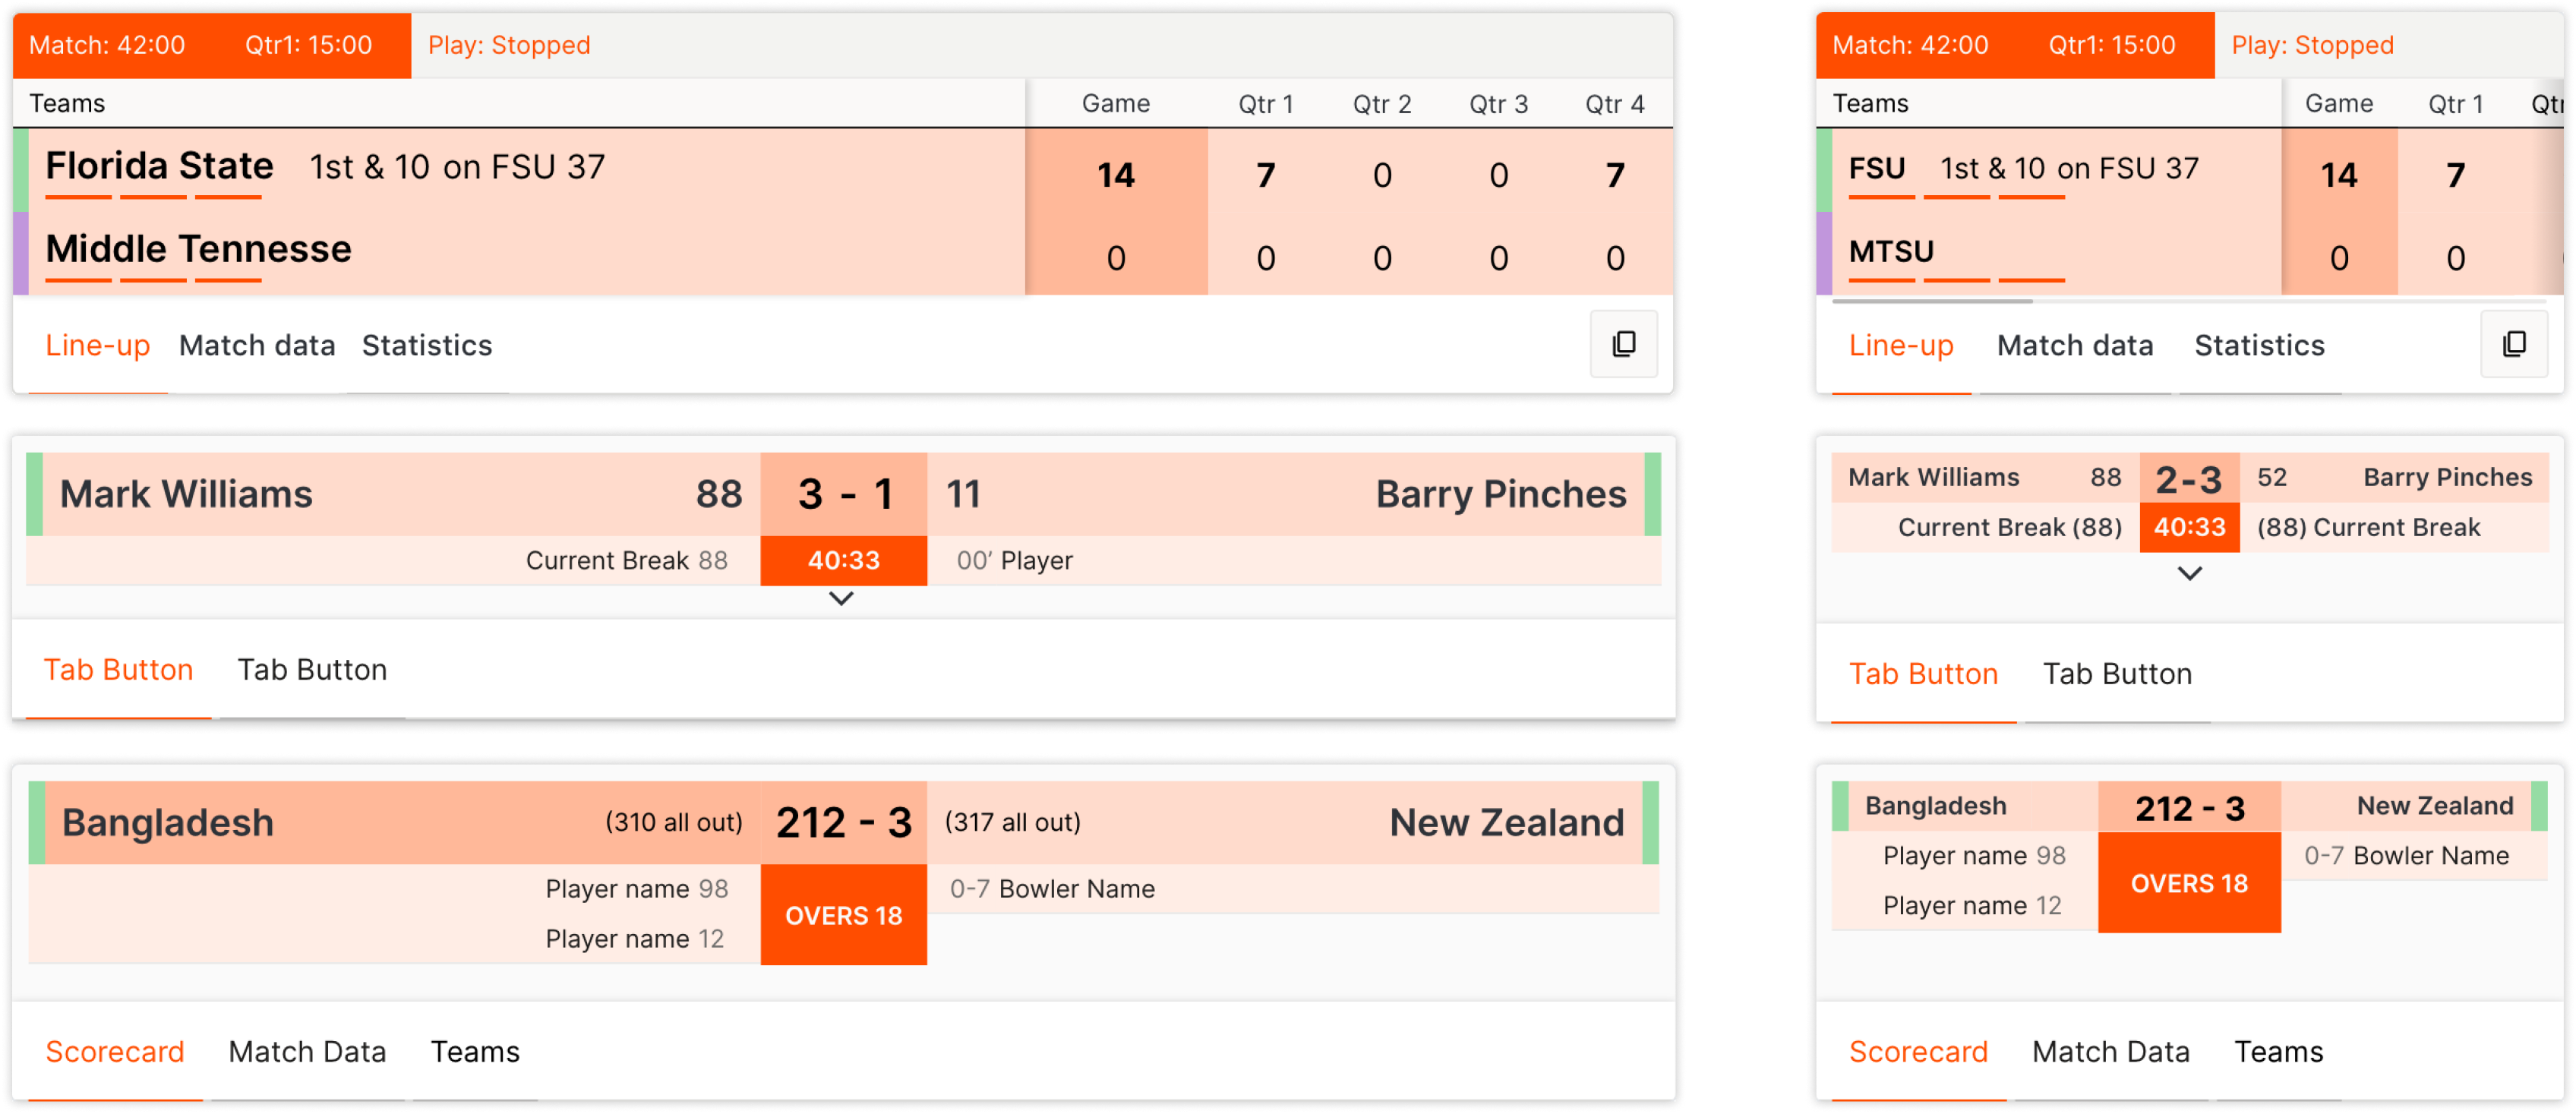
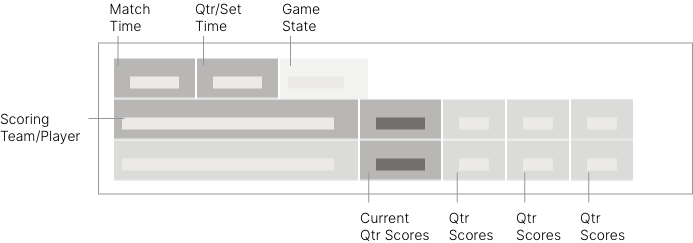
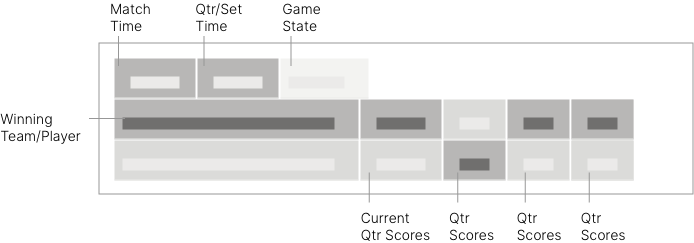
Scoreboard states
Different states of play for the sports were represented by a change in background colour or font weight to highlight a change in play or the leading team.
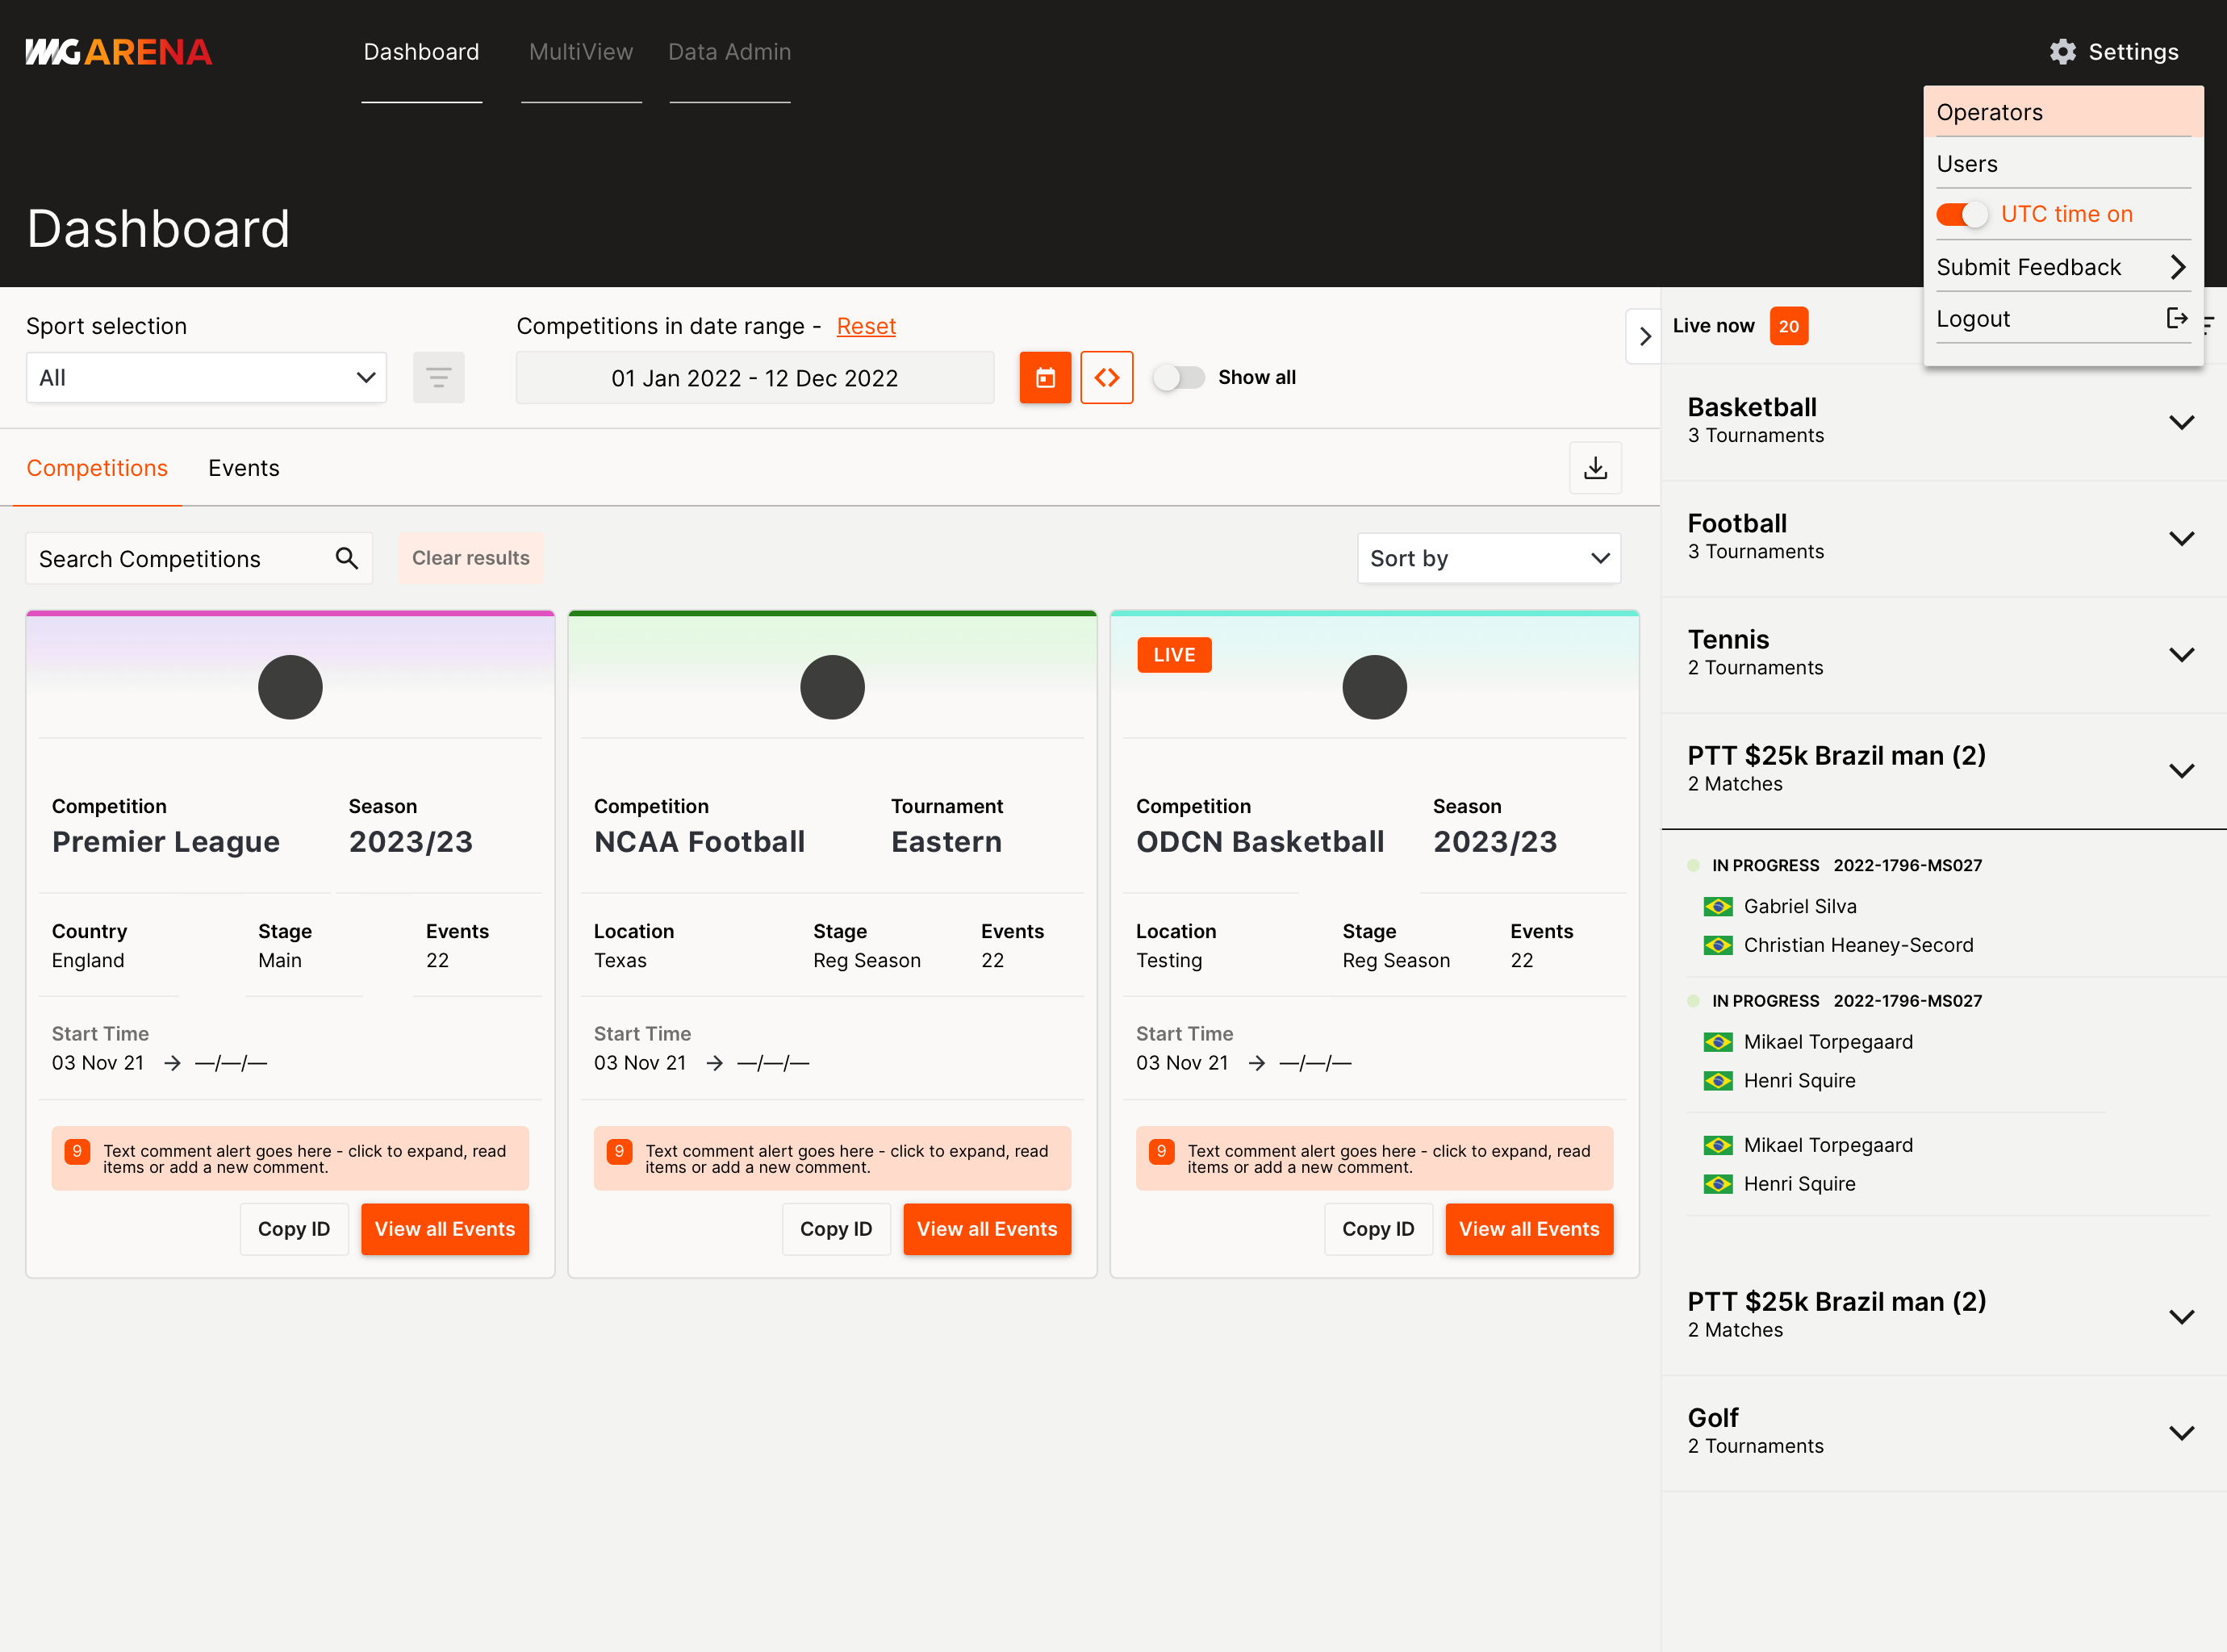
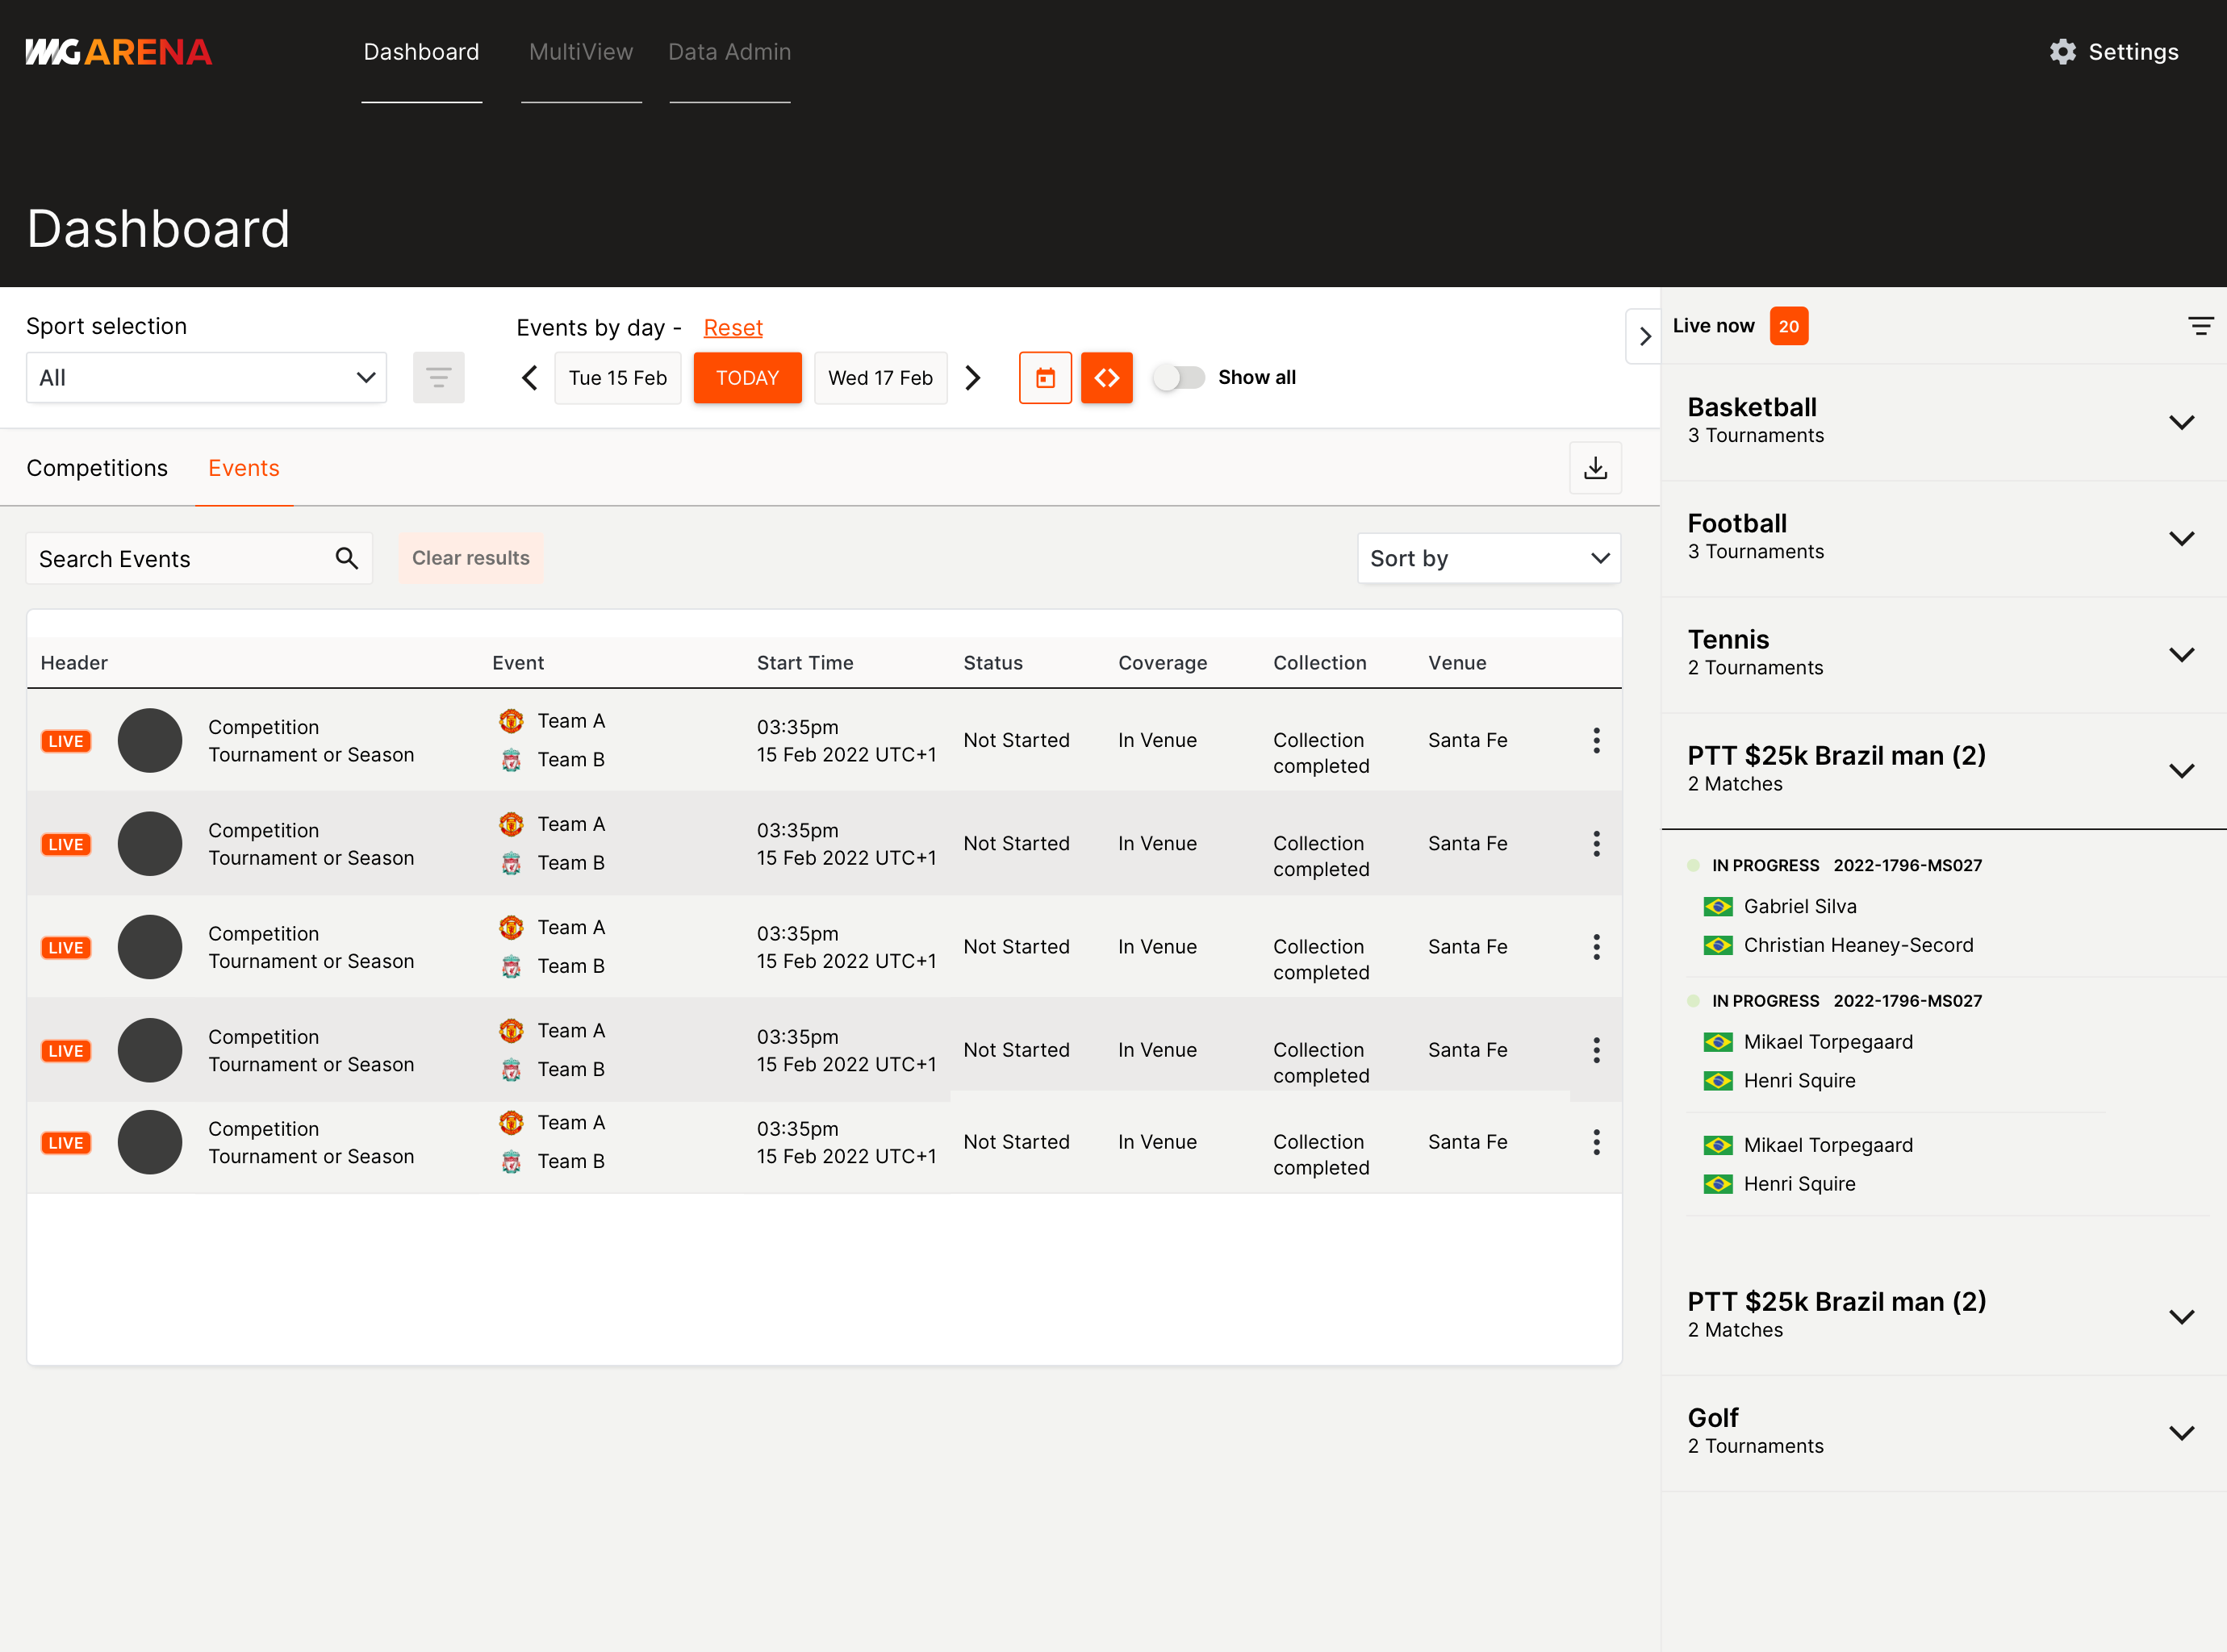
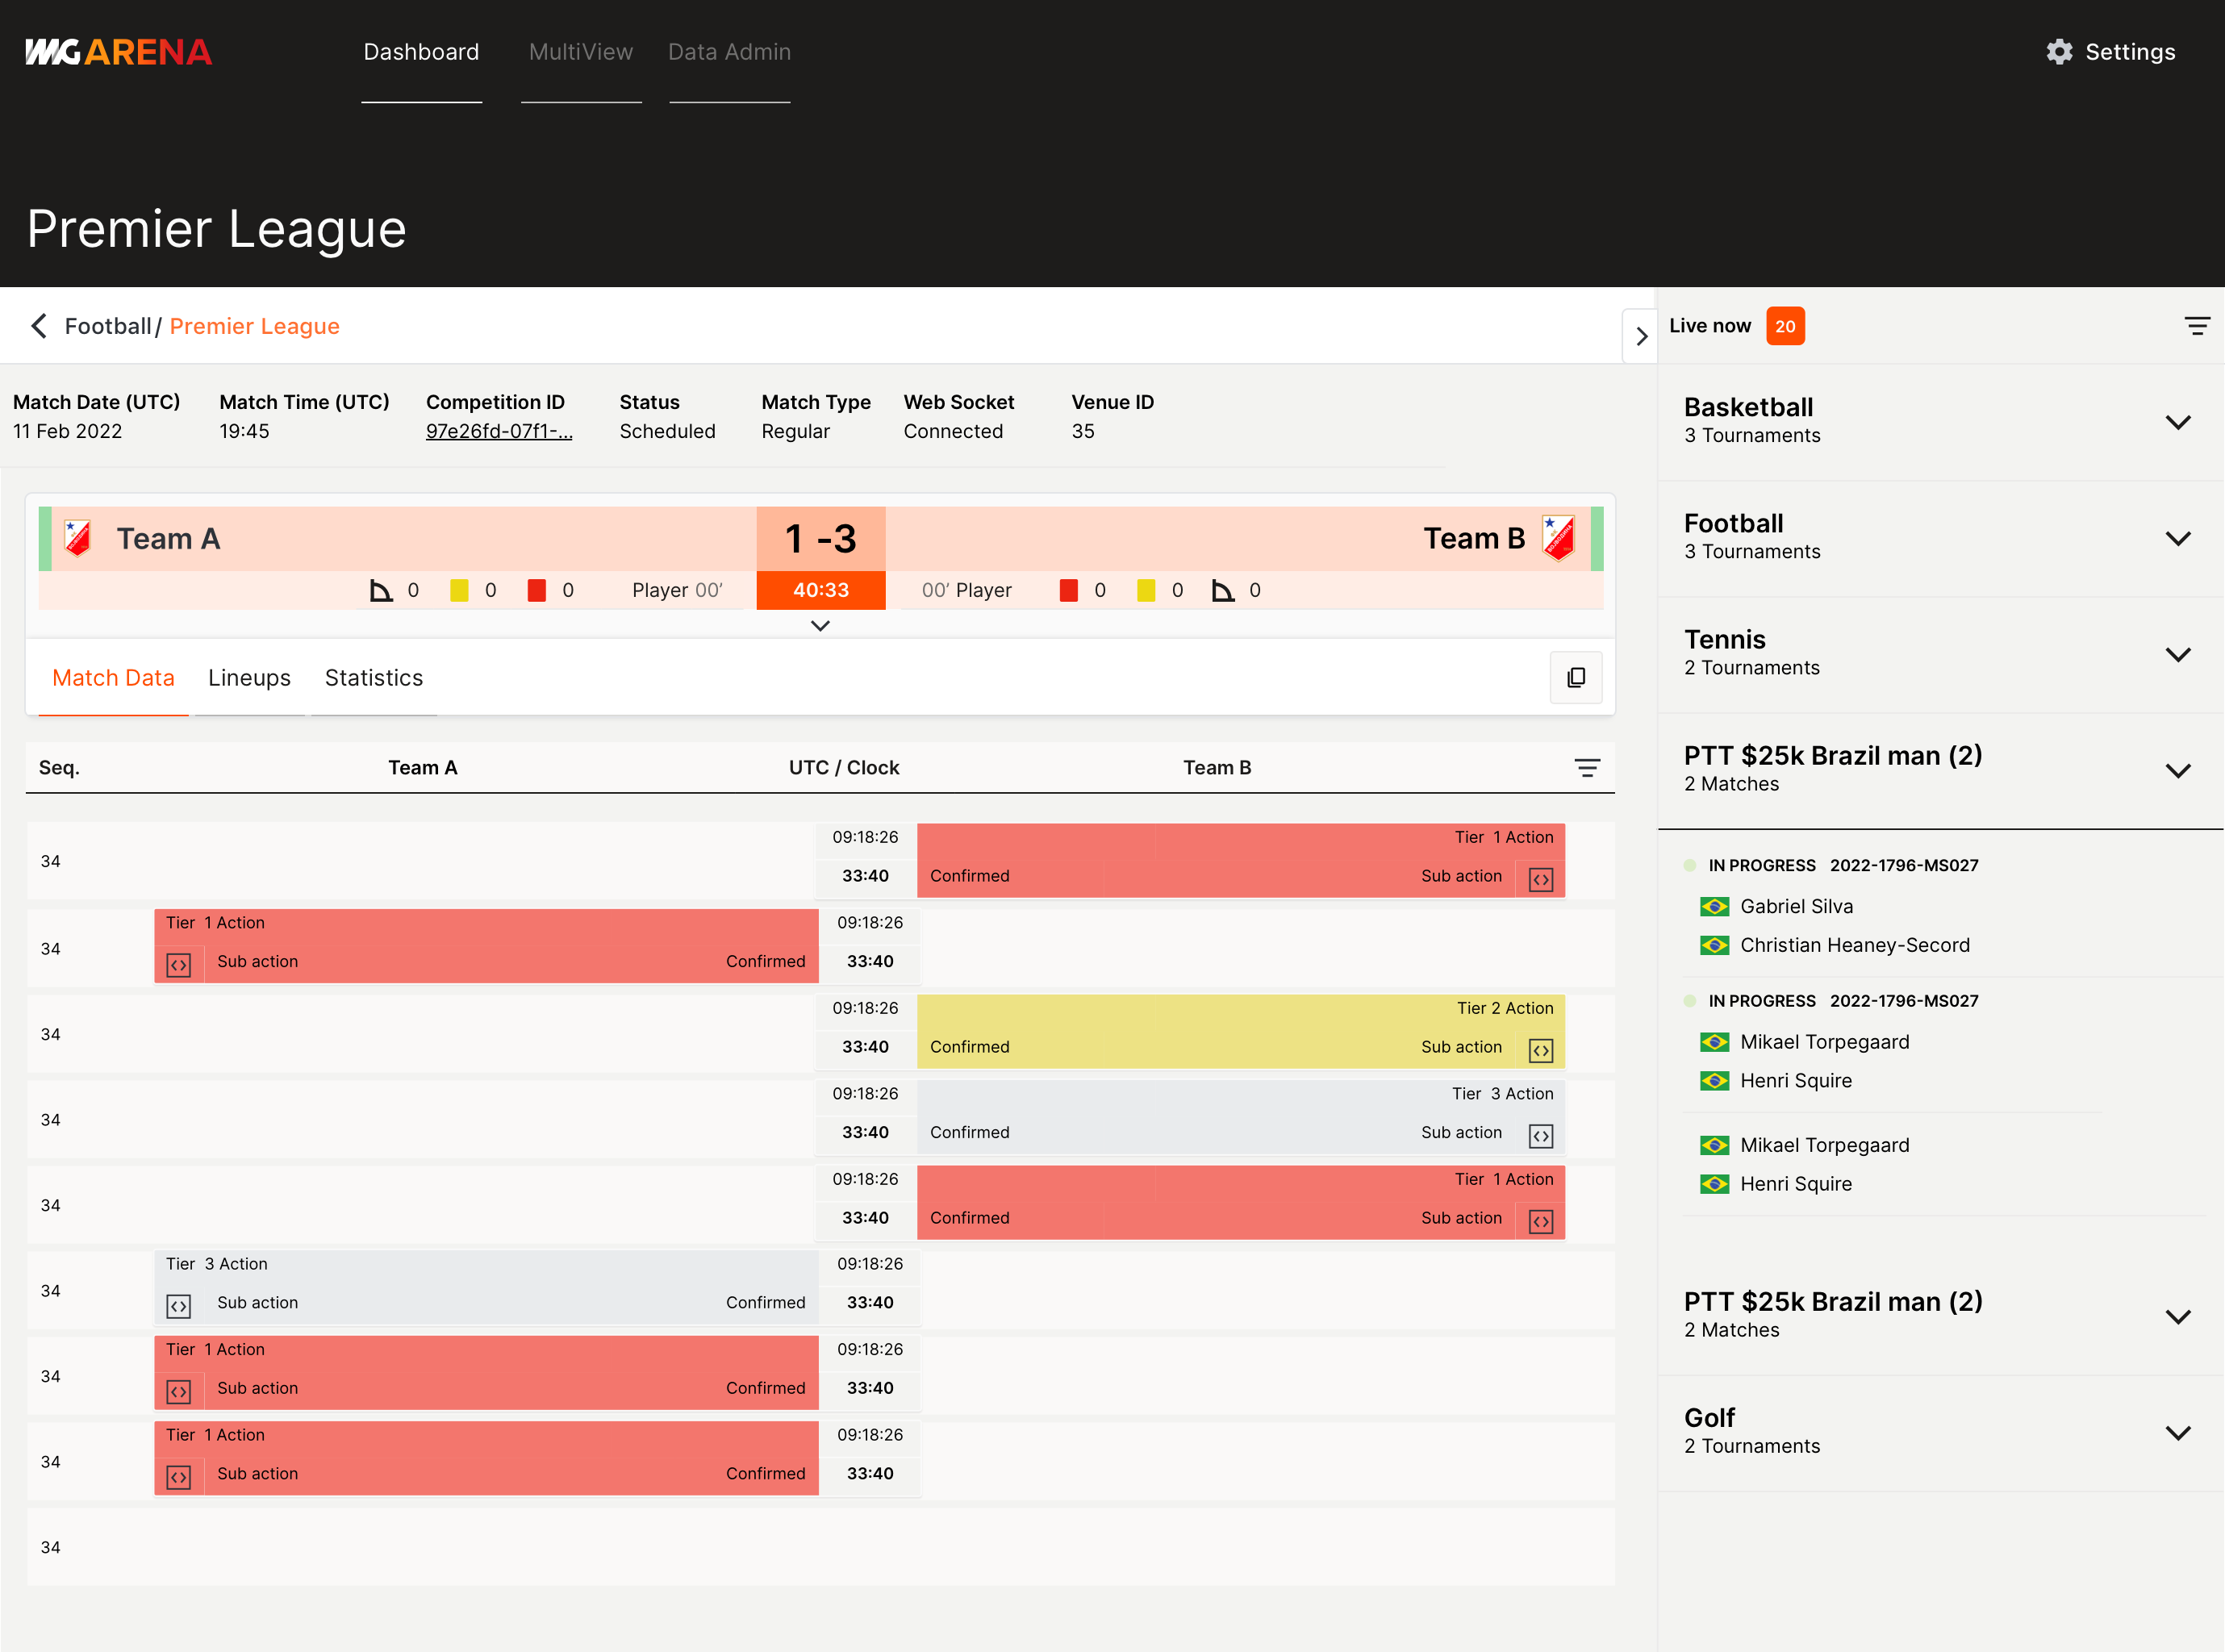
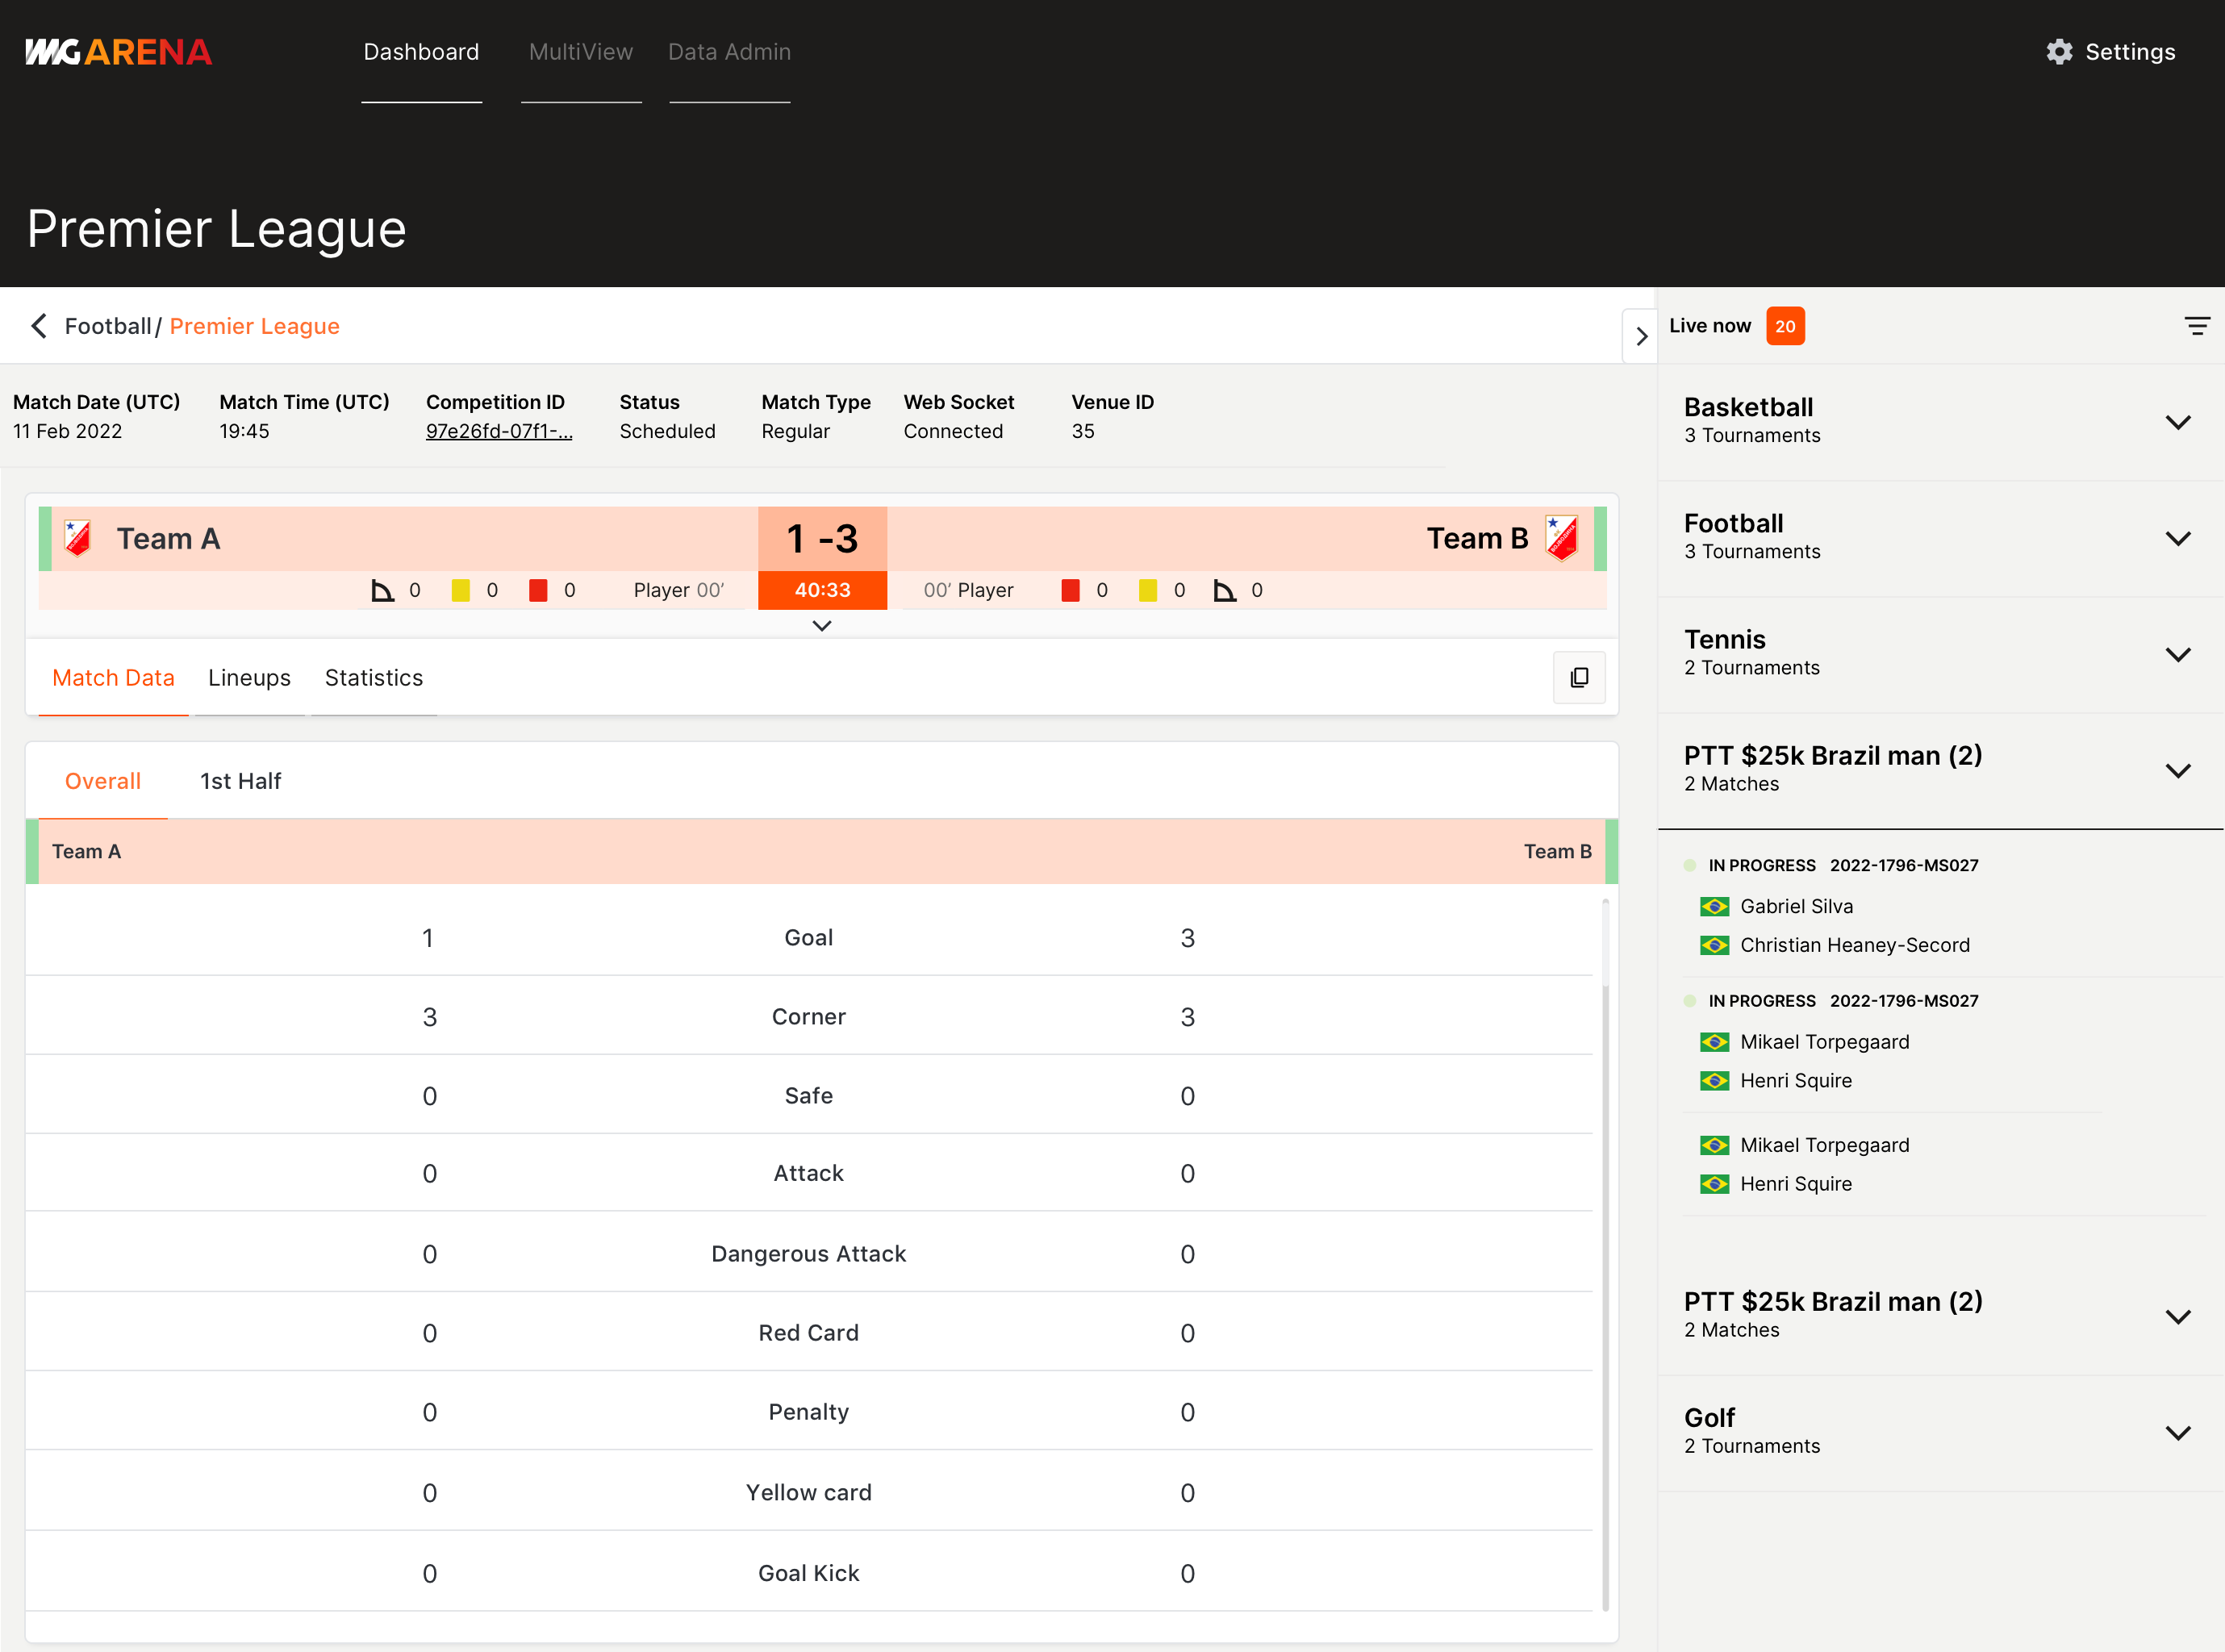
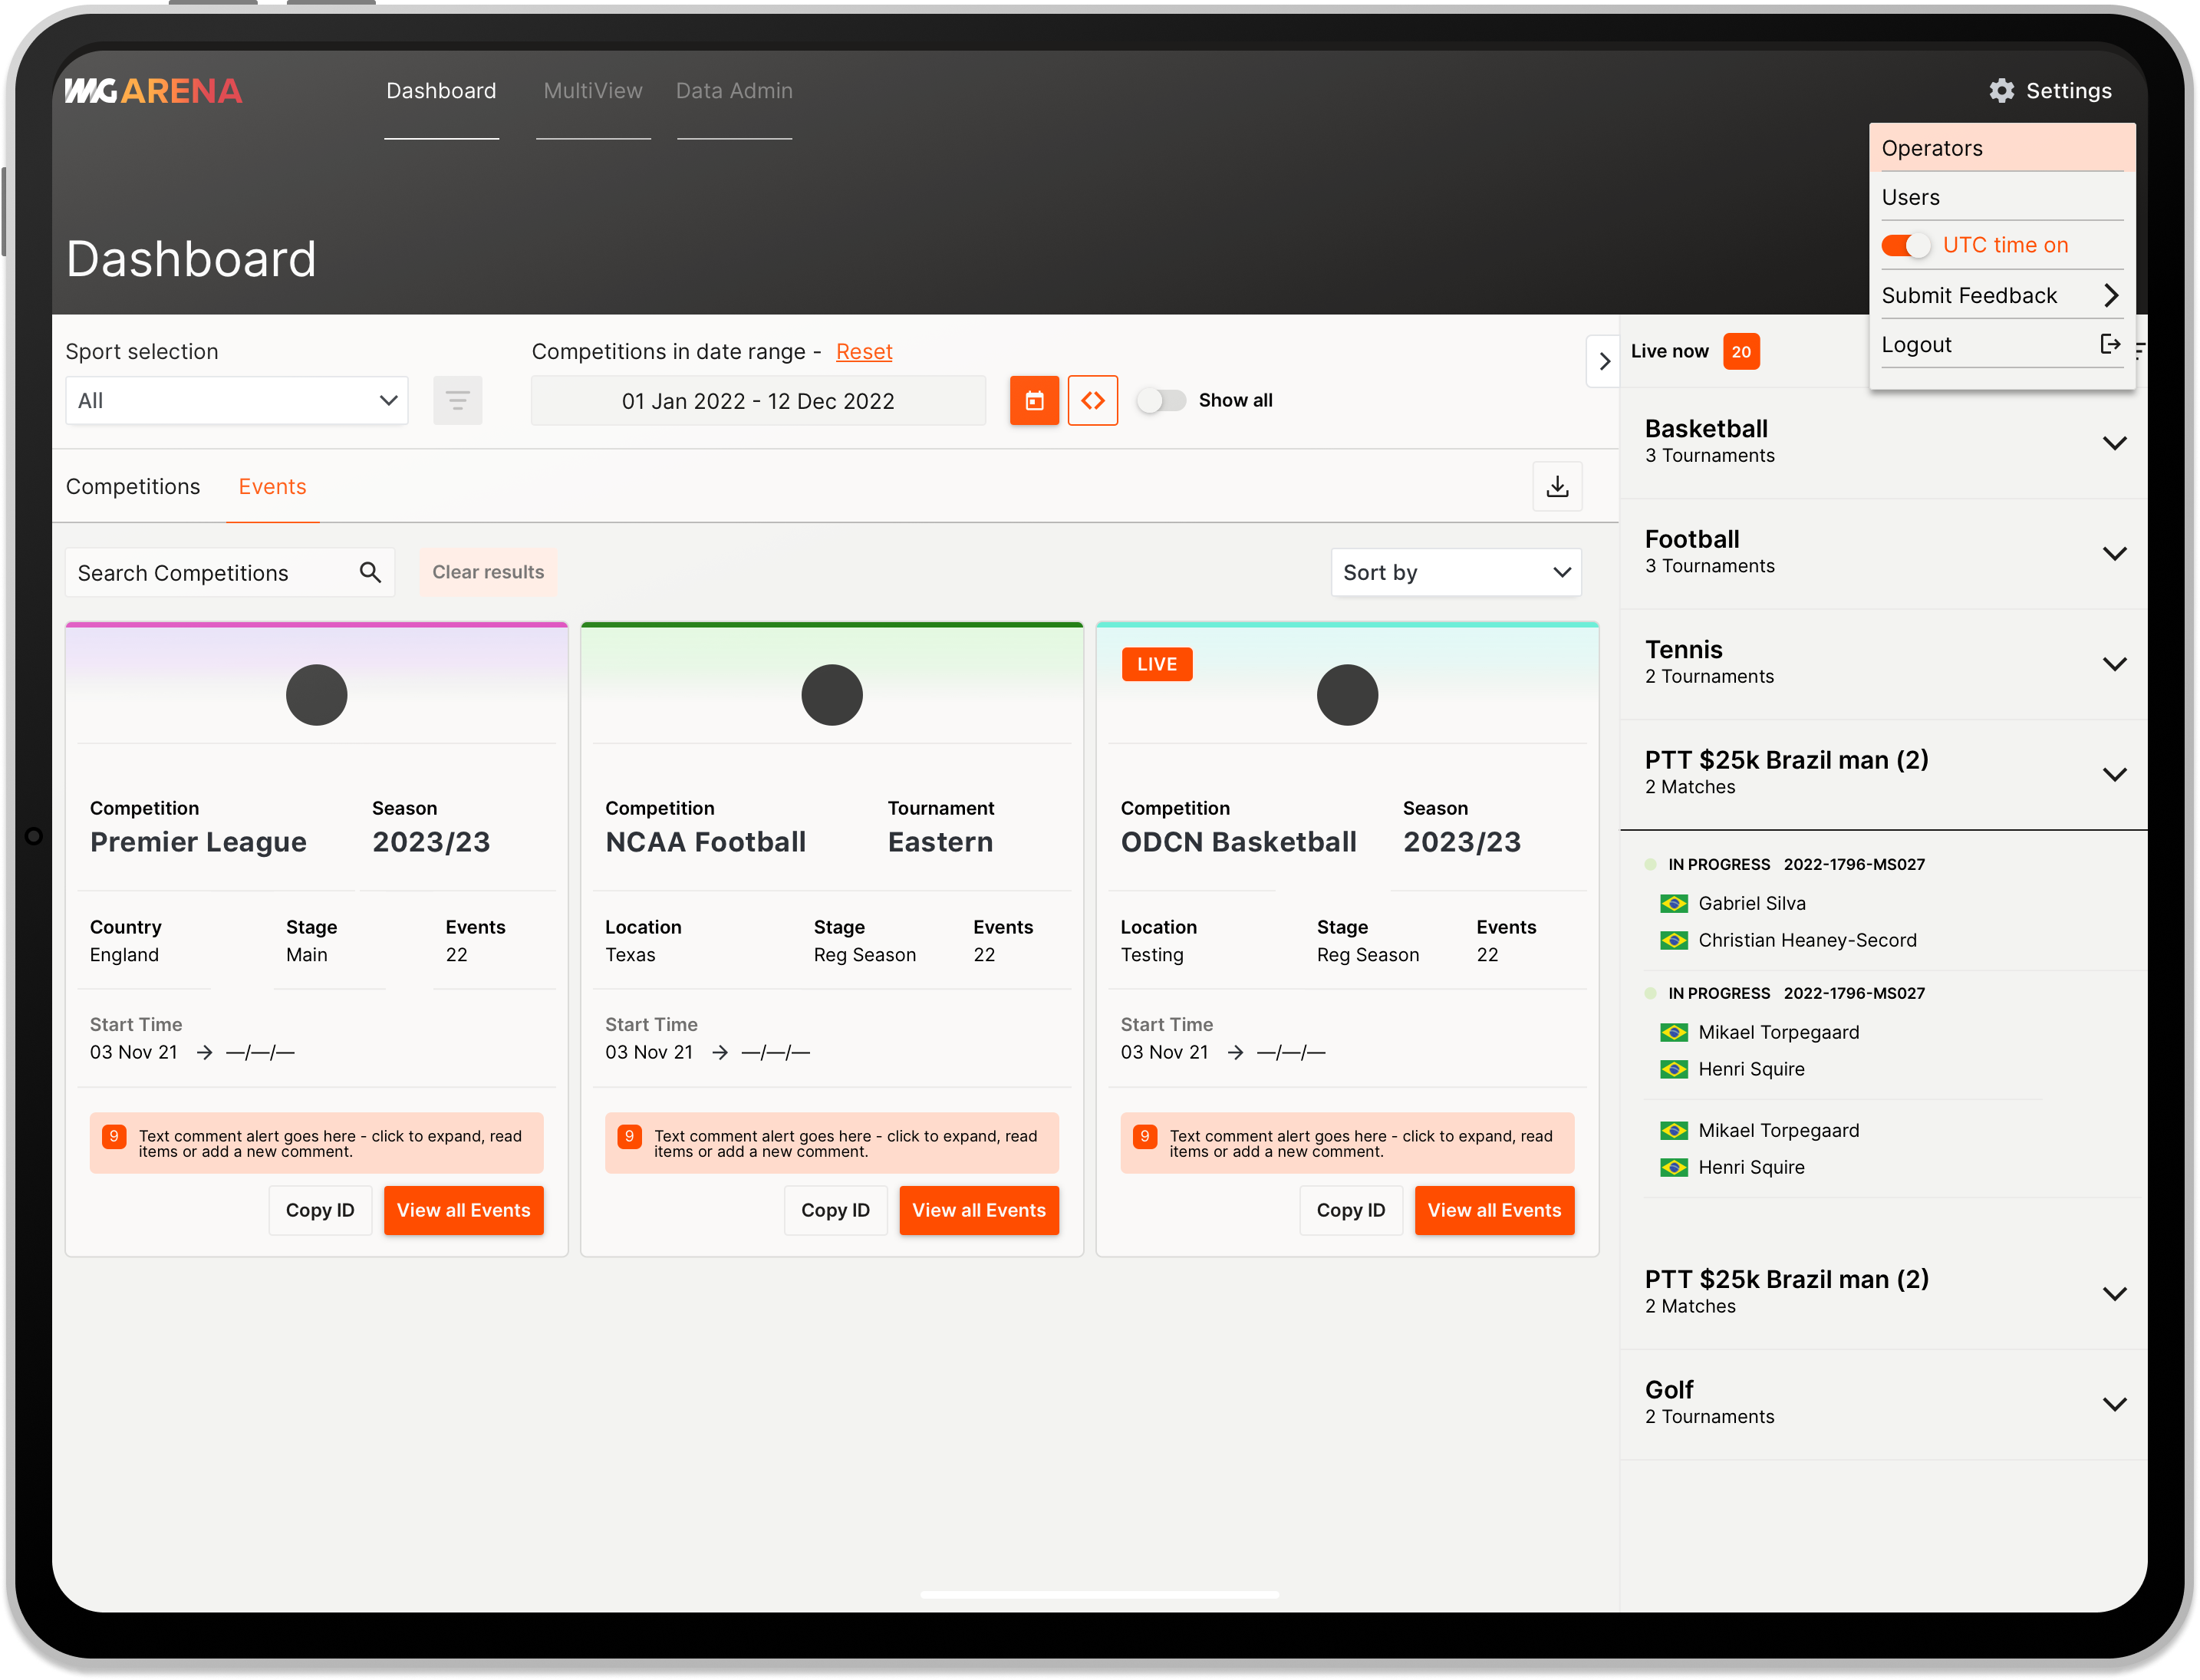
Full page designs
The console consists of 4 to 5 main templates to deliver multiple sports to the users. Starting with a Dashboard view, filterable via Competitions (Card view) or Events (Table view). When at a tournament level all fixtures of a tournament are displayed with more detail. Viewing a Game/Match displays a game template with a scoreboard, in-play actions, line-ups and statistics.

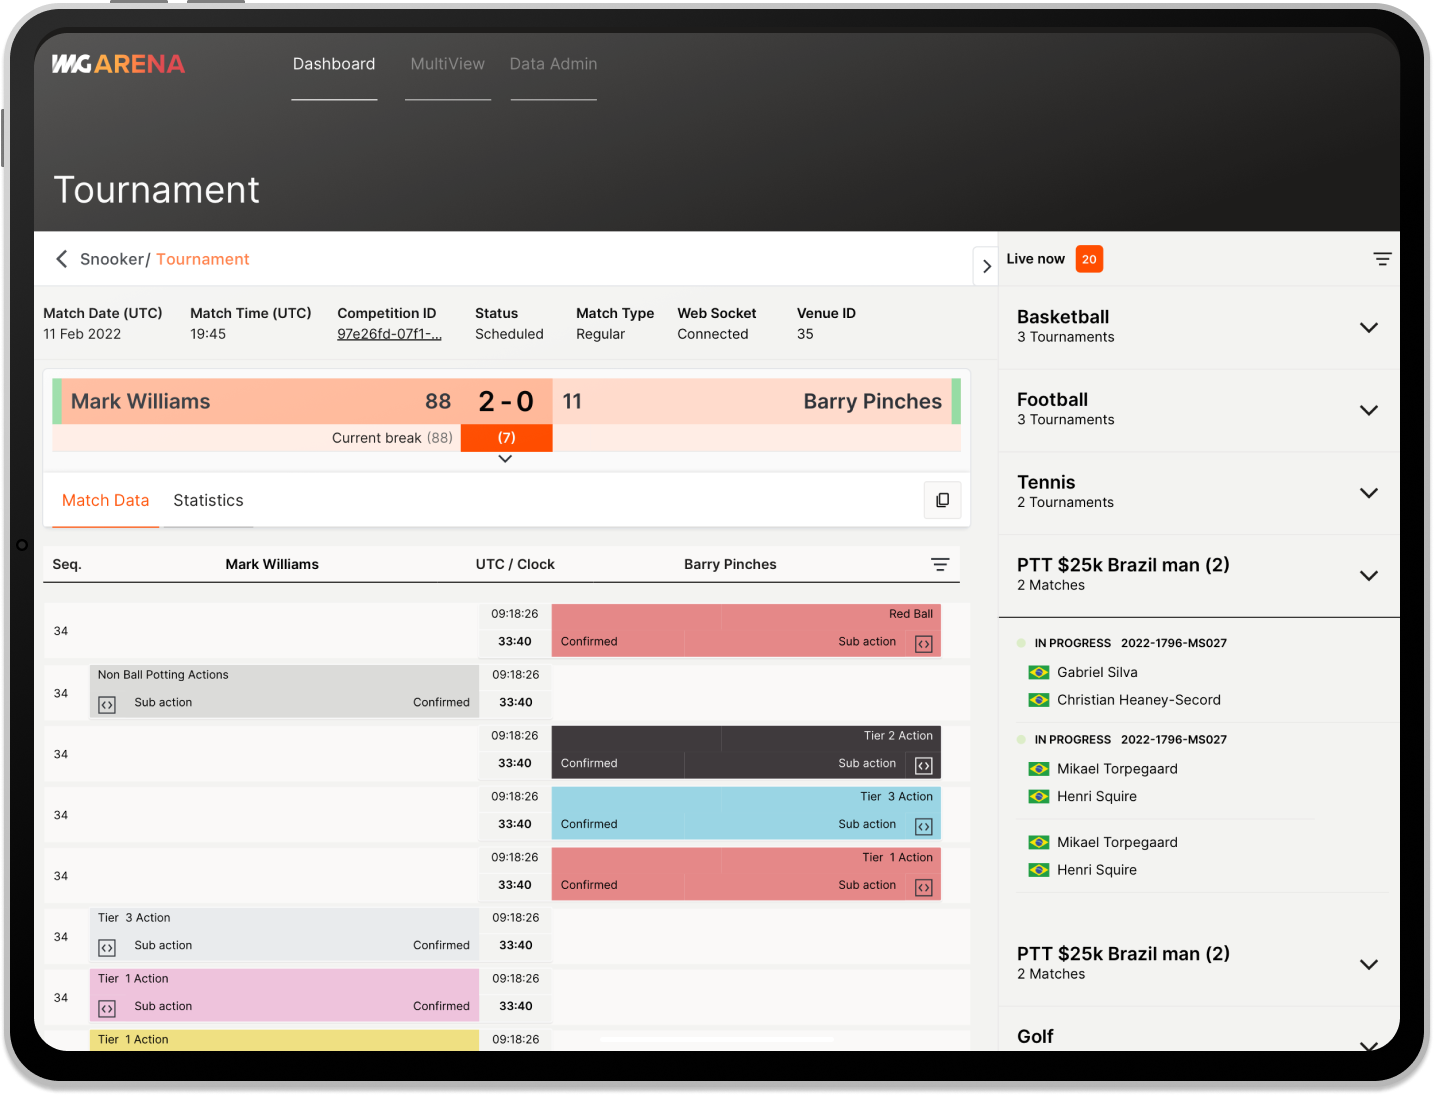
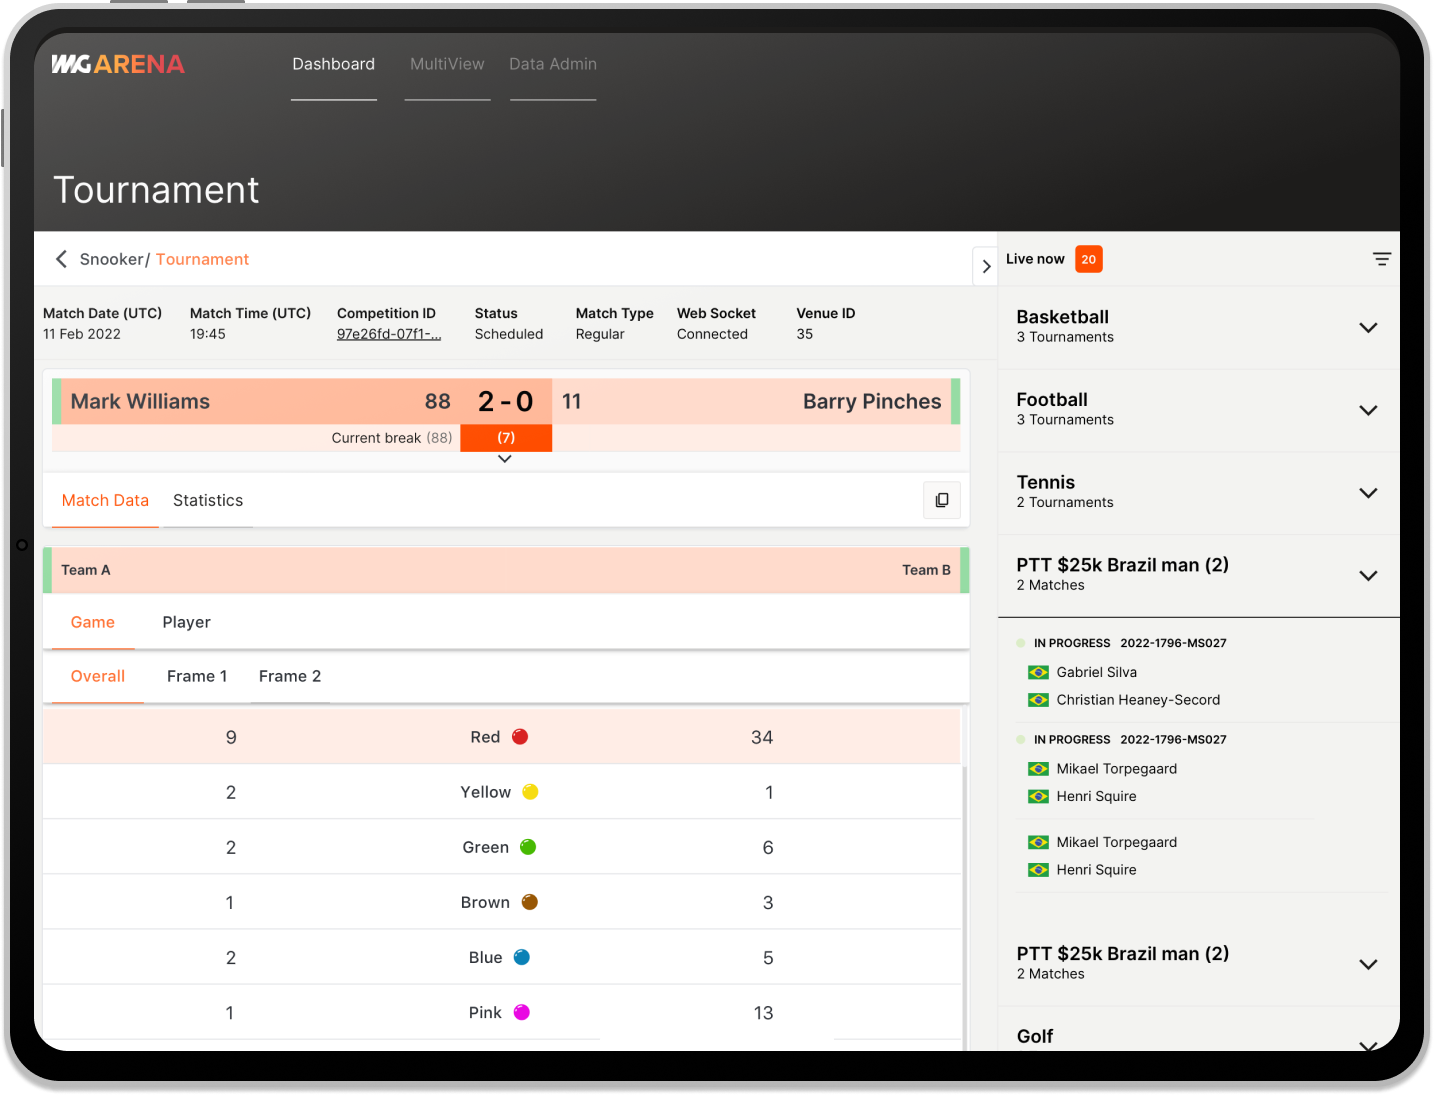
Snooker implementation
The screens below demonstrate how the templates flexed to deliver the Snooker sports data.
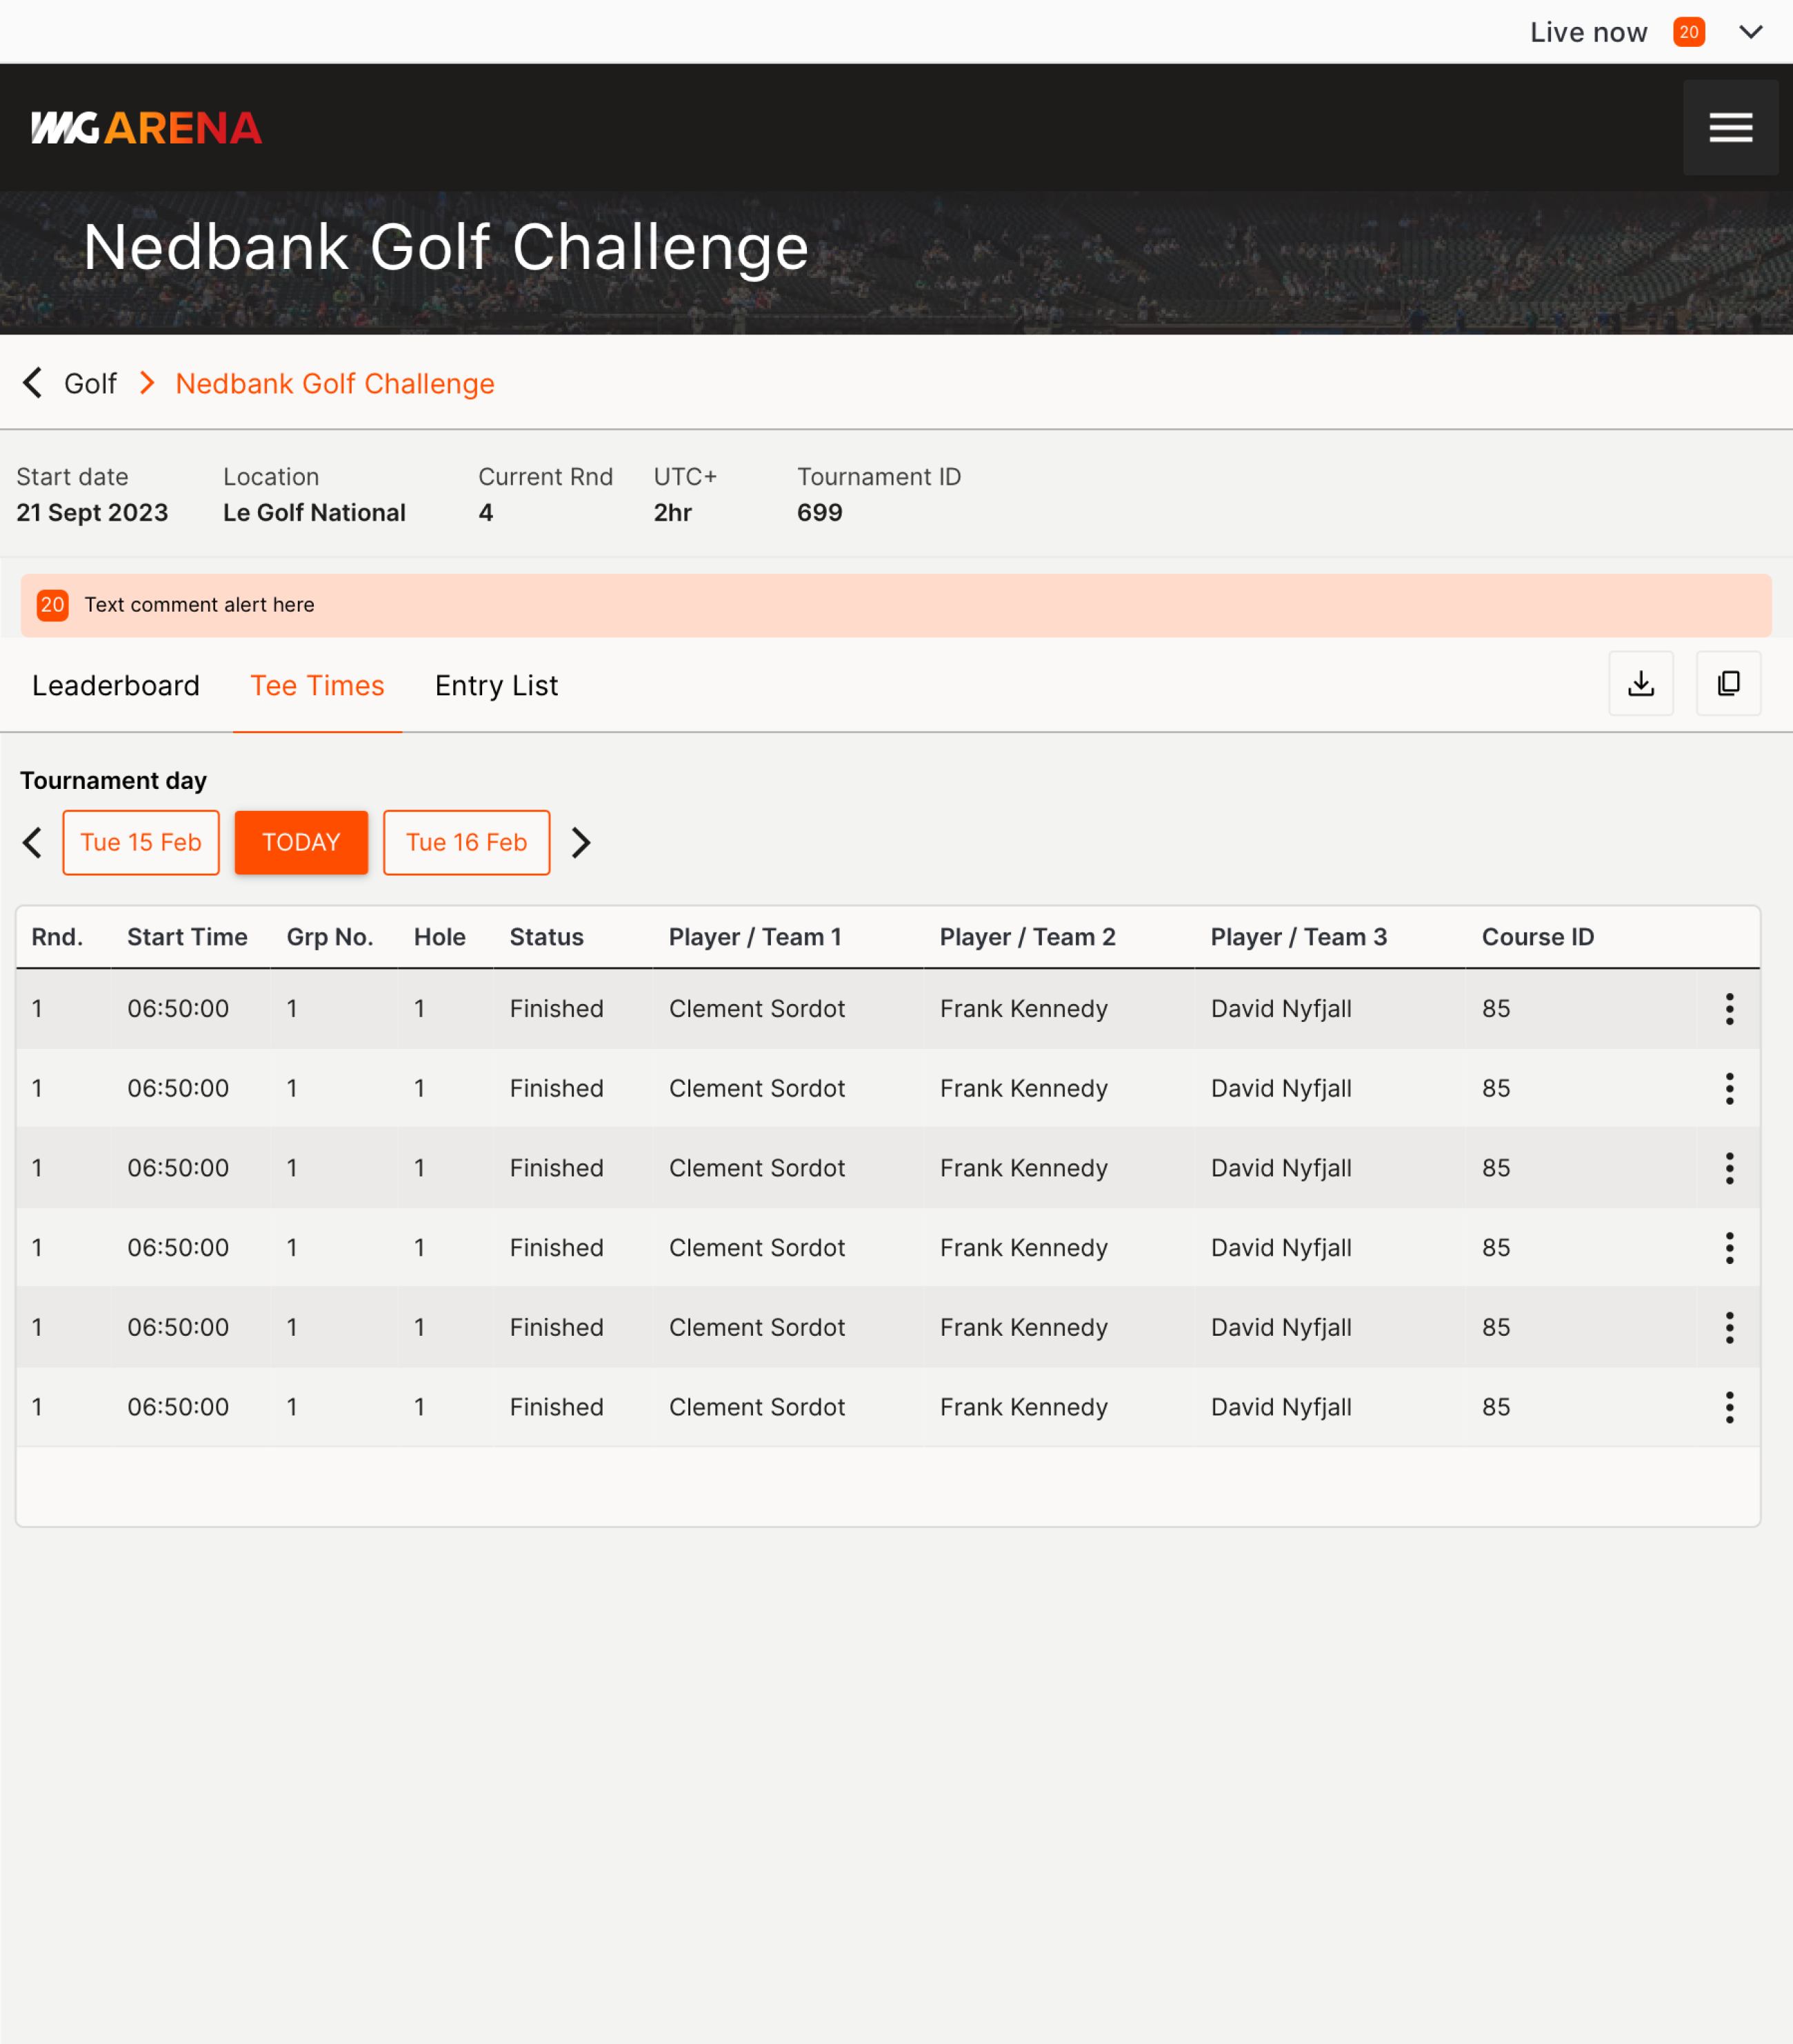
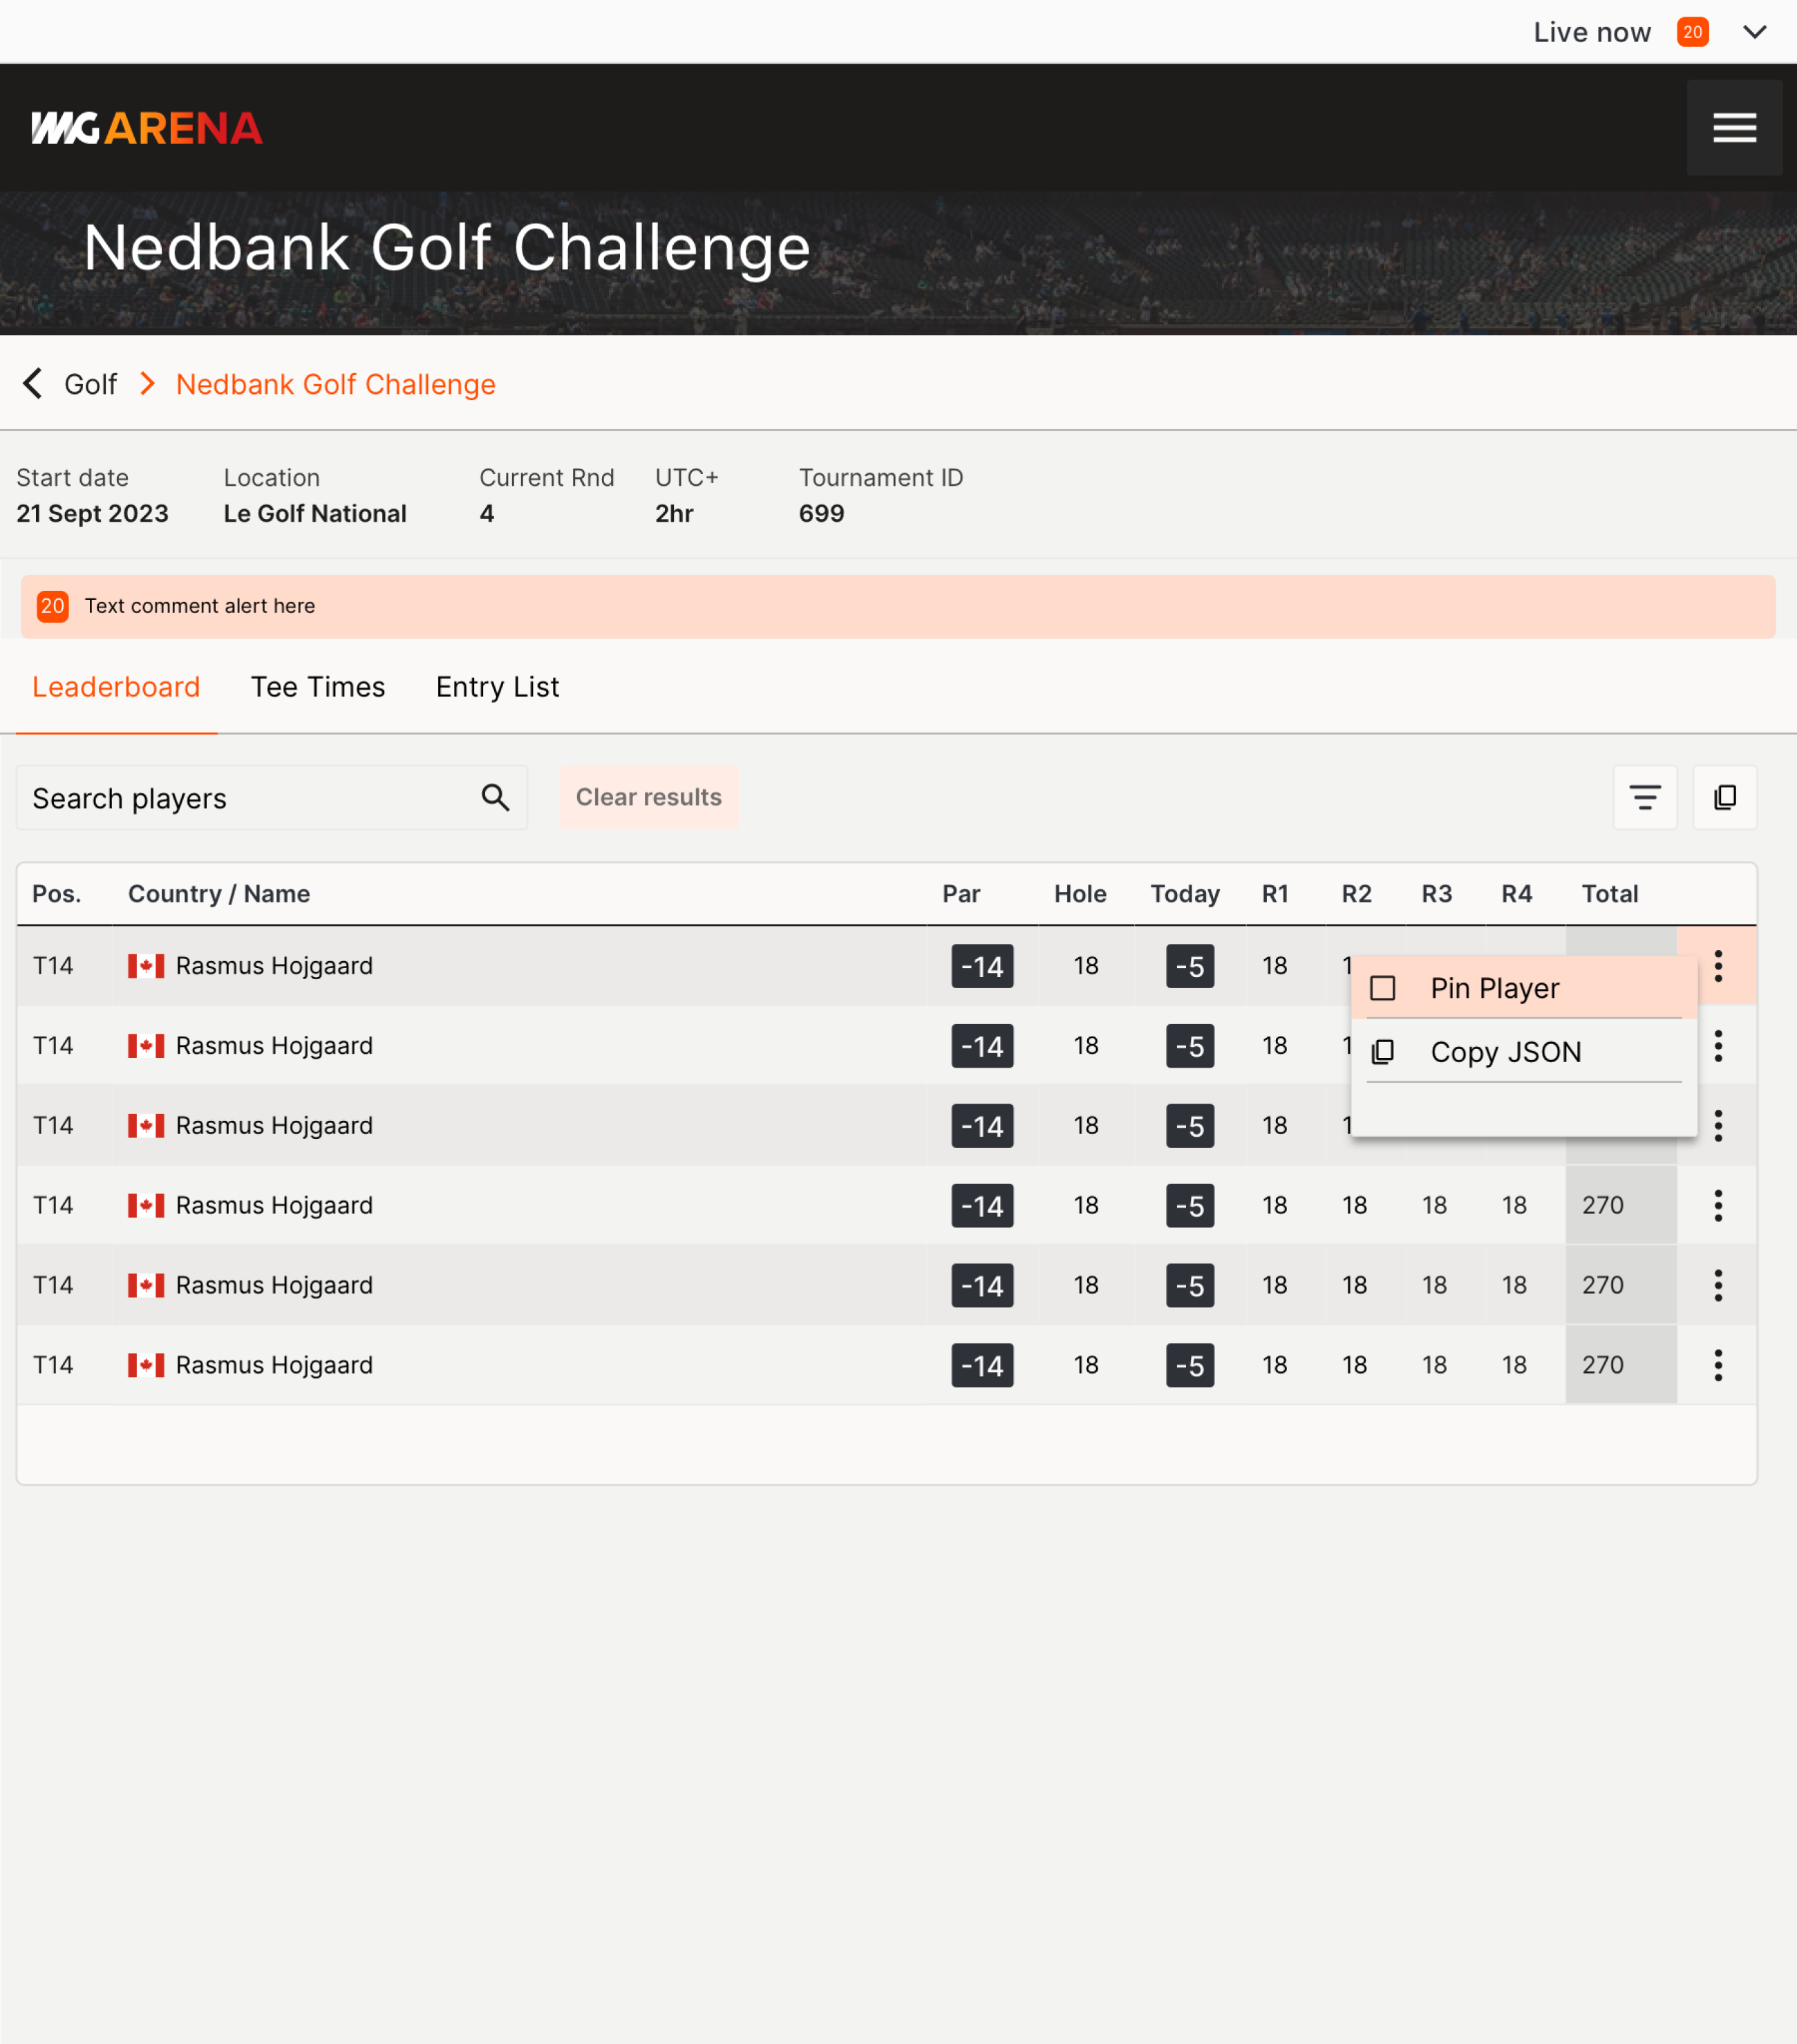
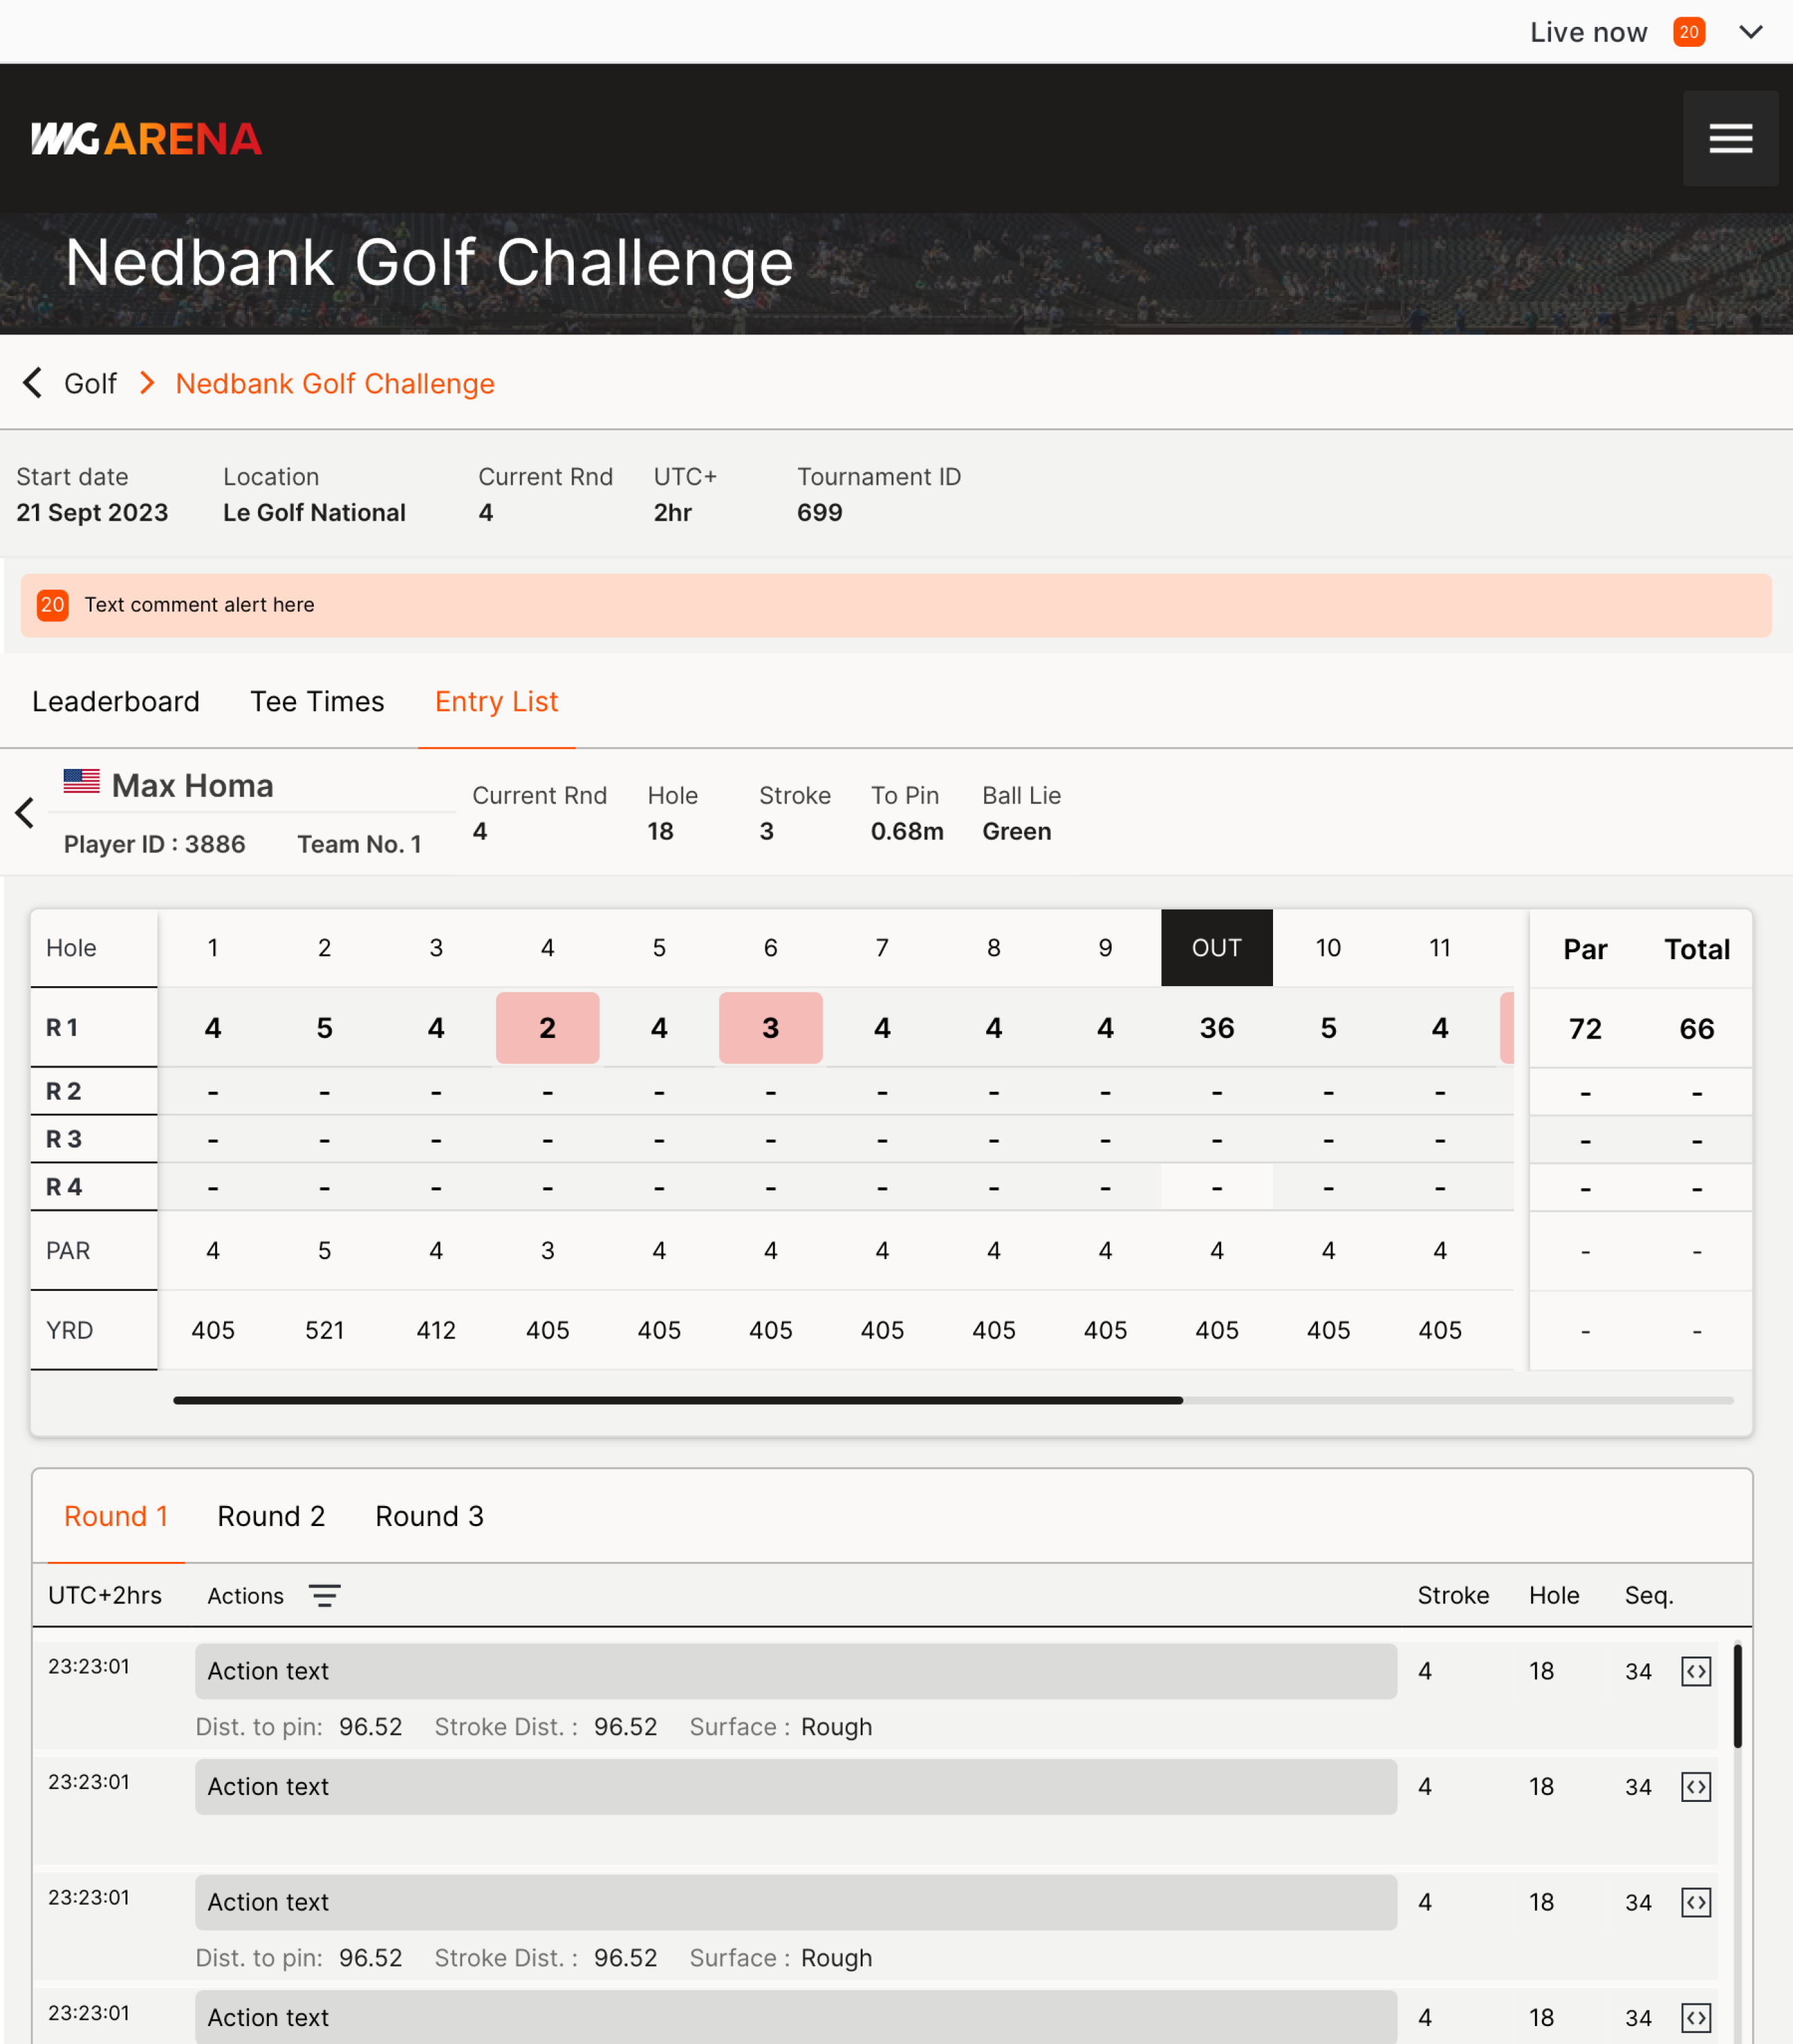
Golf implementation
To deliver golf, it required a change in core templates due to the nature of change in data feeds. However the atomic design elements were still used to deliver a new set of templates for all future golf tournaments and events.
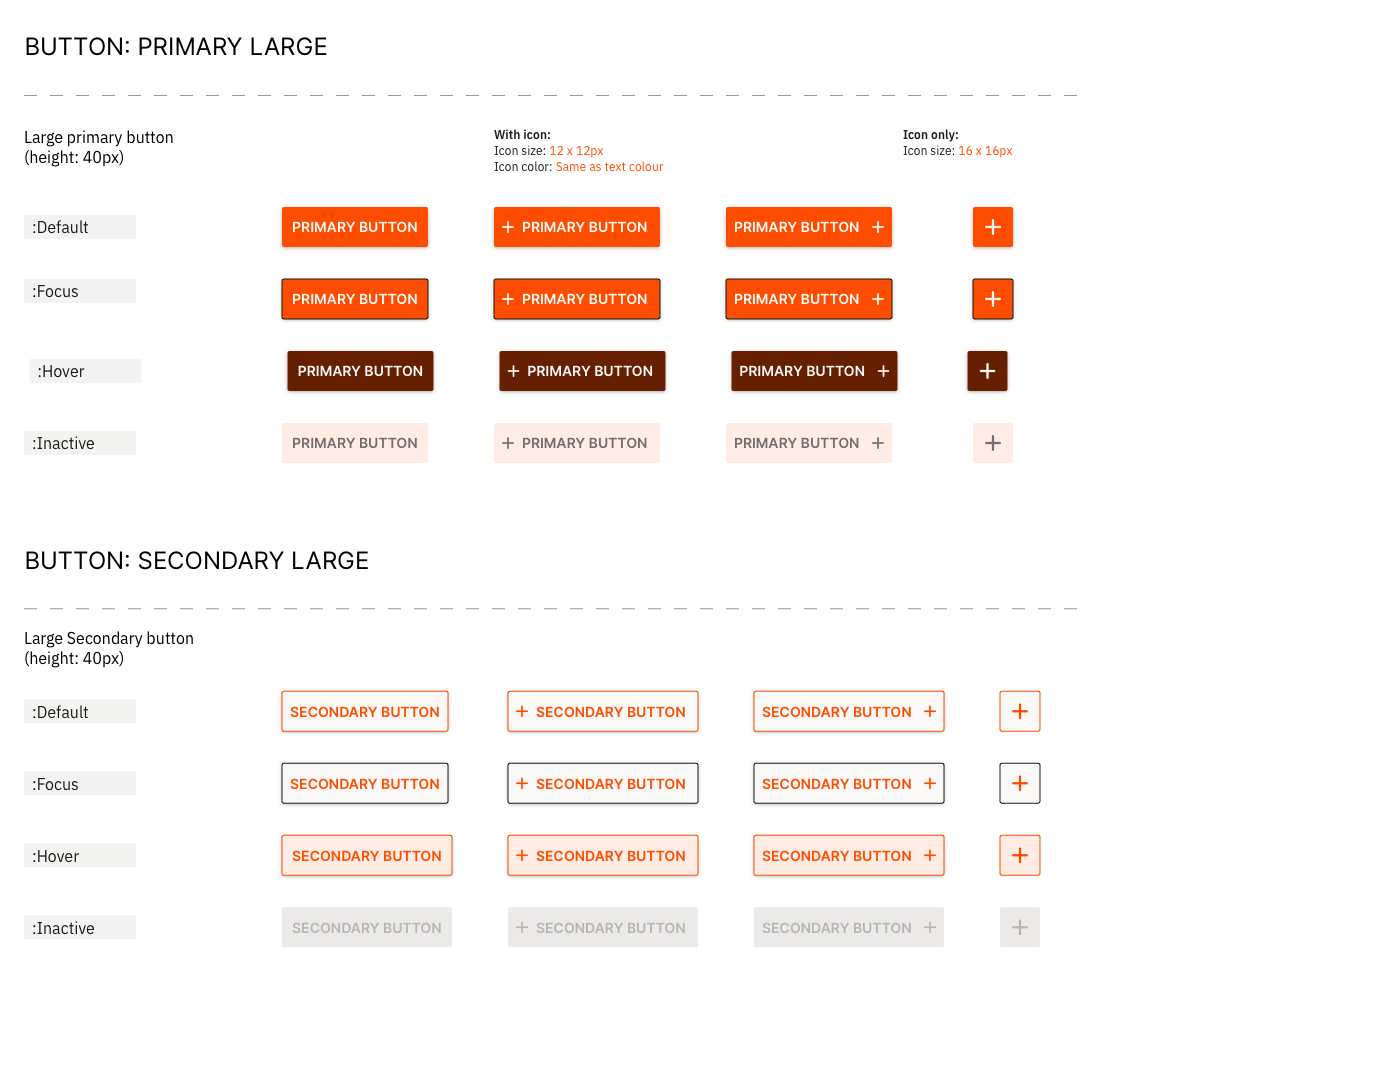
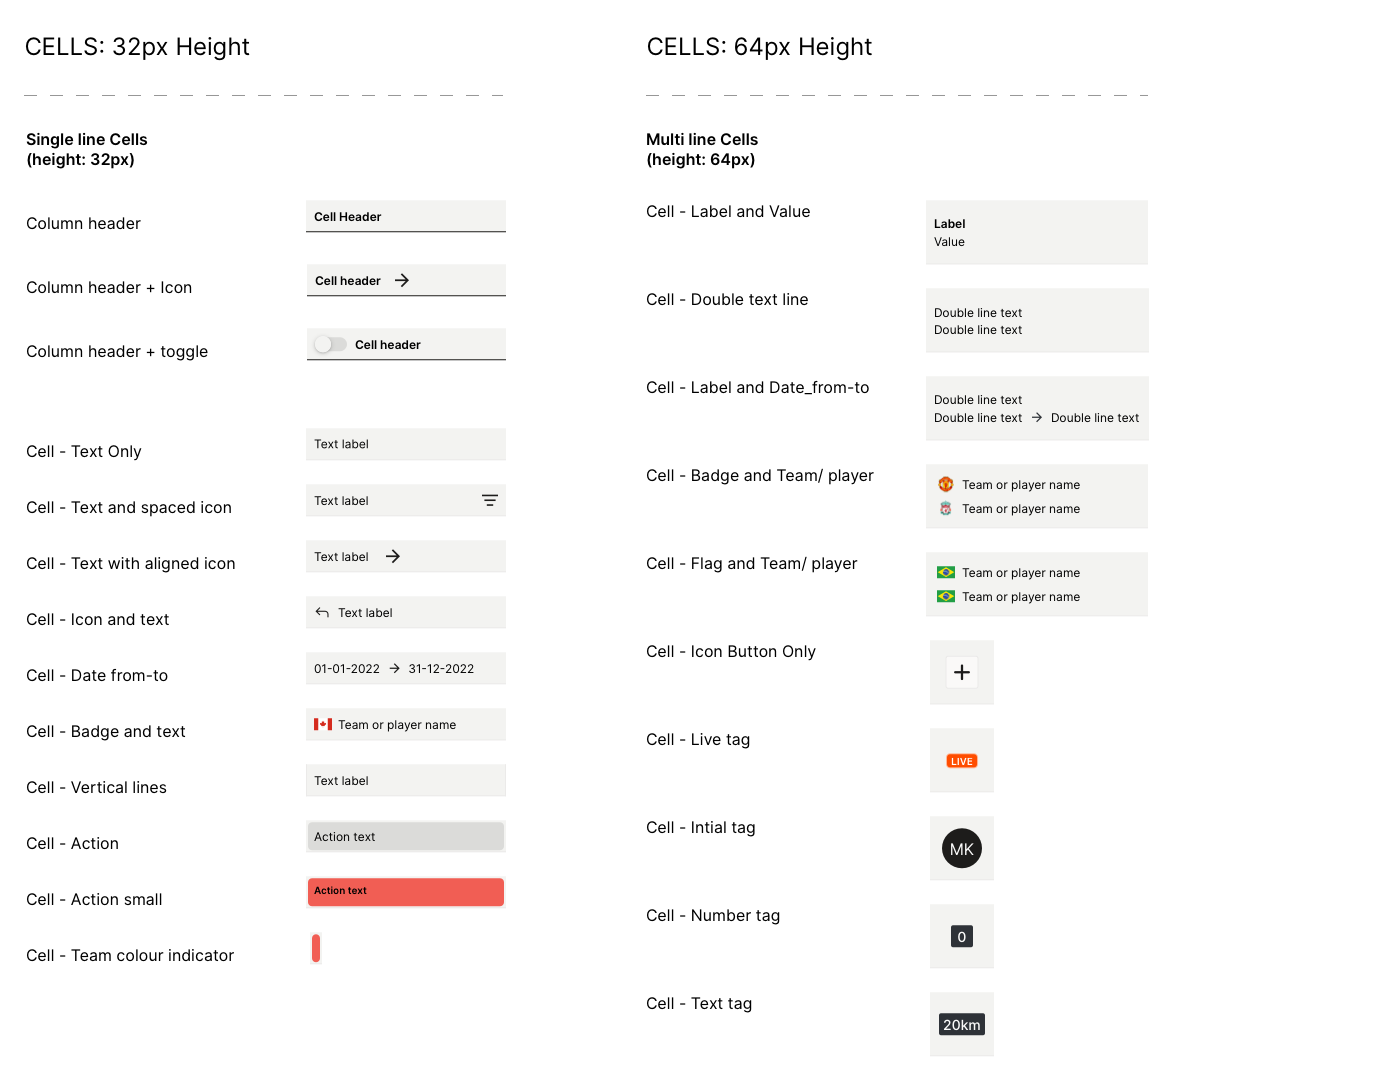
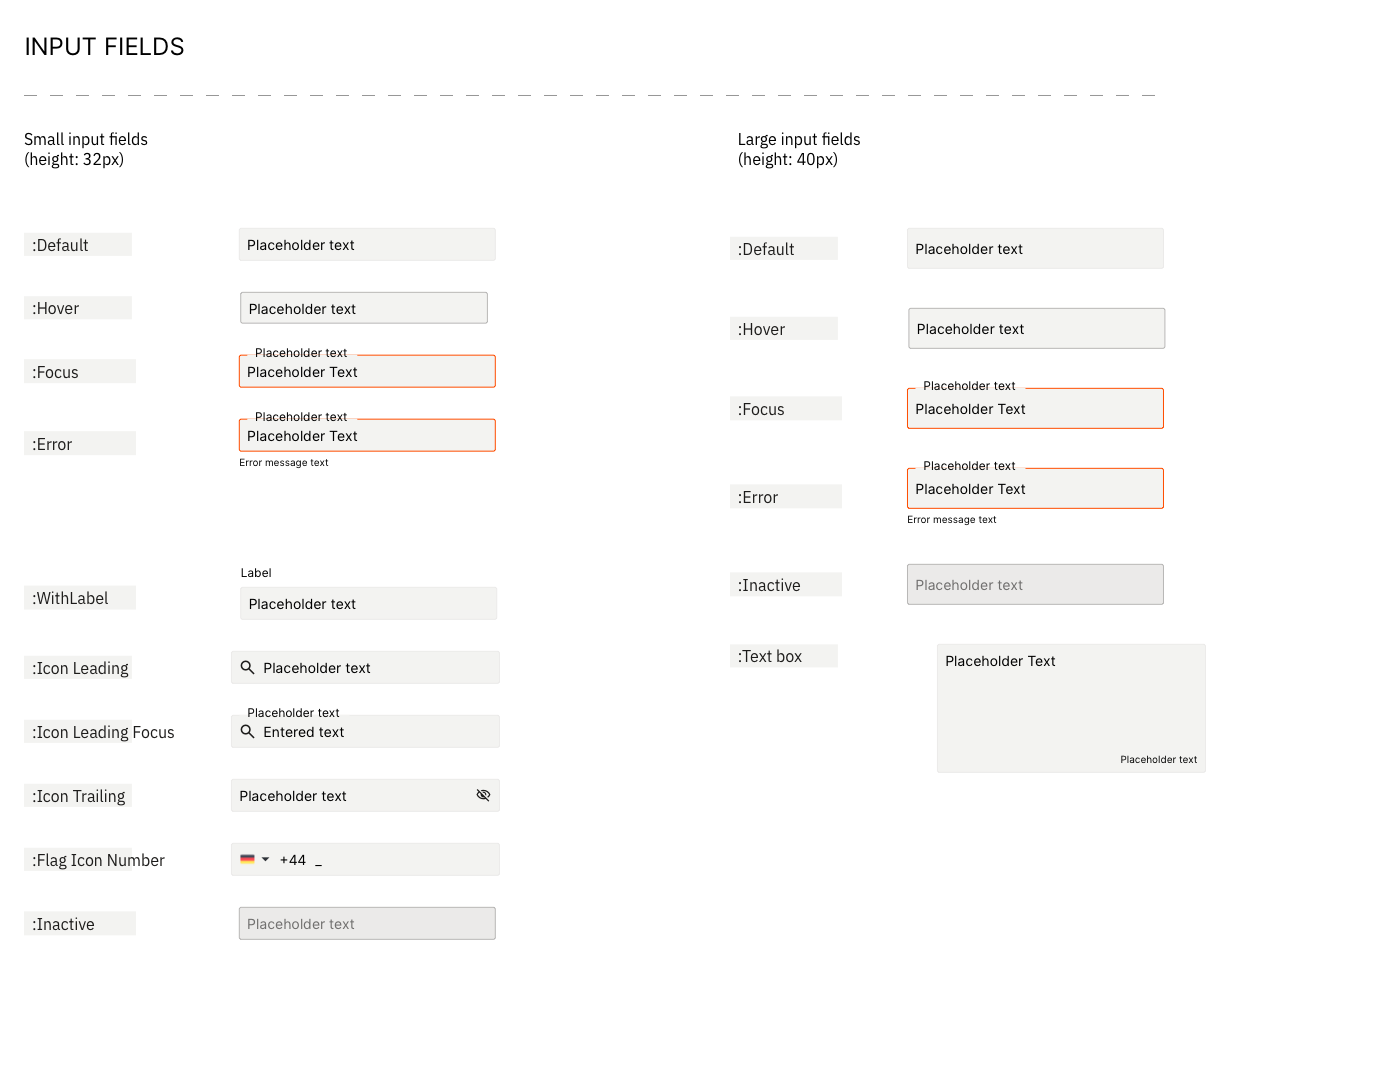
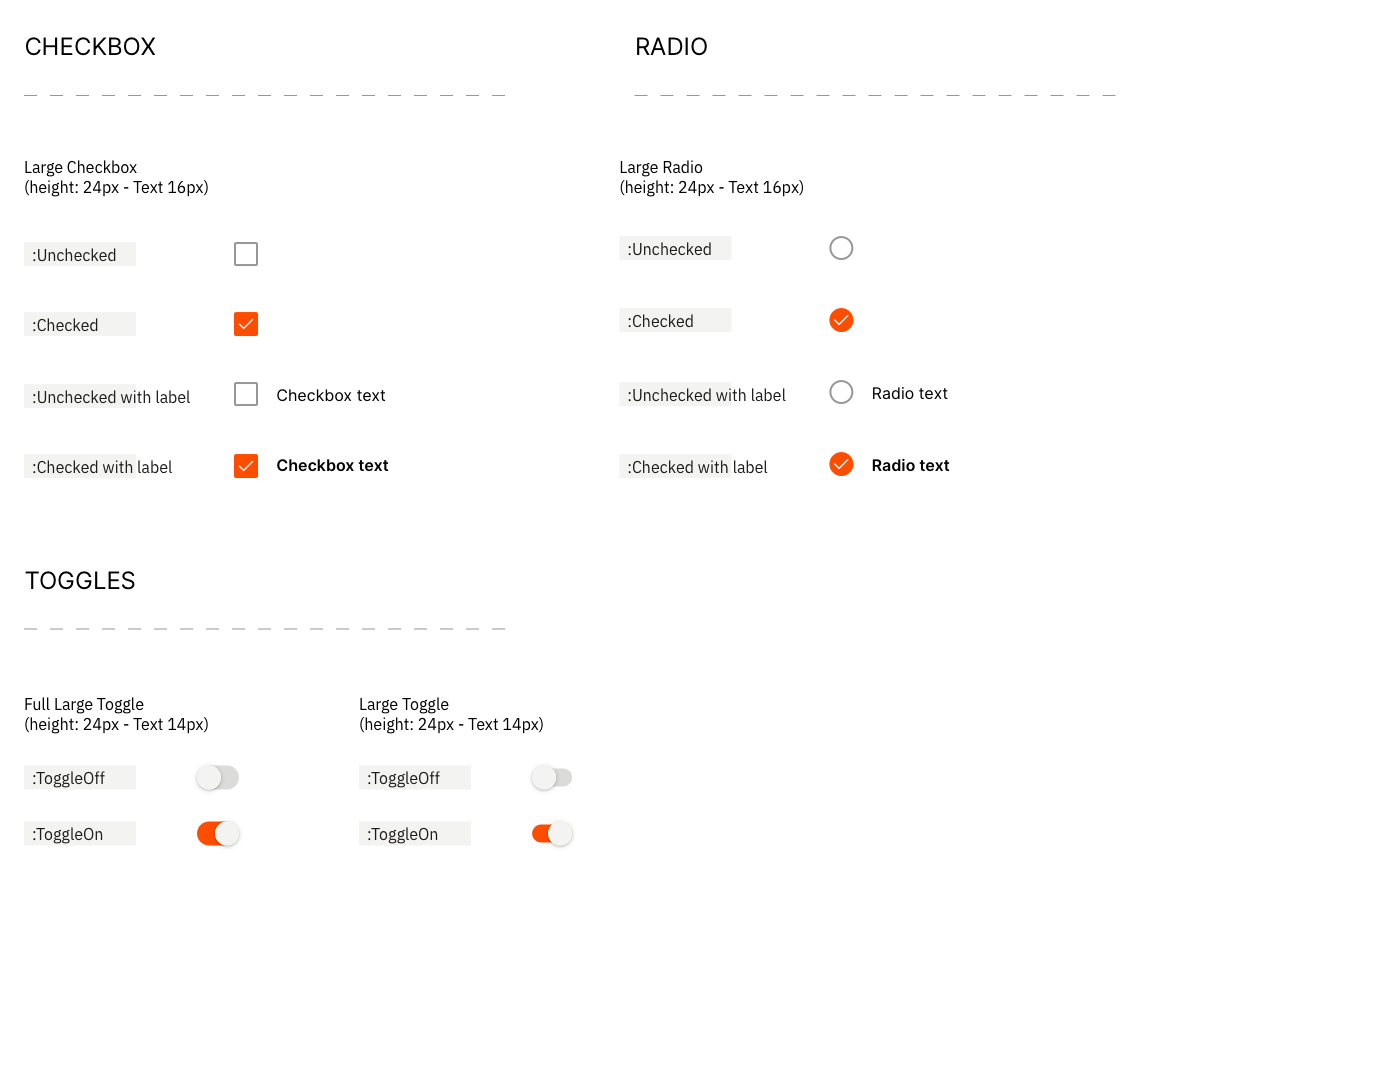
Design system
A light design system was created to provide the team with a platform for the ongoing addition of sports or features and functions. Below are some of the sheets from the design system.
Selected Projects


B2B Sports Data Platform - UX /UI DesignProject type


Grosvenor - UX/UI DesignProject type


Duke Of Edinburgh Award - Social CampaignProject type

Property MarketingProject type

KitKat - The Break Emoji Social CampaignProject type

Special Olympics - Encourage Omar CampaignProject type

HiltiProject type
CalpolProject type

Brand Films - Concept / Art DirectionProject type